OWN THE FUTURE · SEASON 3 · RAPID URBANIZATION
How does Sweden move, counted in journeys and freight?
Transport moves people and goods, and the way it is done has changed several times. We explain what the system looks like today, counted in journeys, freight and energy.
Published 10 Sep 2026 · About 9 minutes to read
In 1950 Sweden was a railway country. The railway carried 6.6 billion passenger kilometres and the car 3.9.2, 13 On the freight side the gap was bigger: the railway 8.6 billion tonne kilometres against the road's 2.7, more than three times as much on rails.2, 13
In 1953 the car alone overtook all rail traffic, with 7.5 against 7.2 billion passenger kilometres.2, 13 Three years earlier rail traffic had been almost twice as big.13 On the freight side it took until 1970, when the road overtook the railway with 17.5 against 17.3 billion tonne kilometres, after three years in which the two were in practice level.2, 13
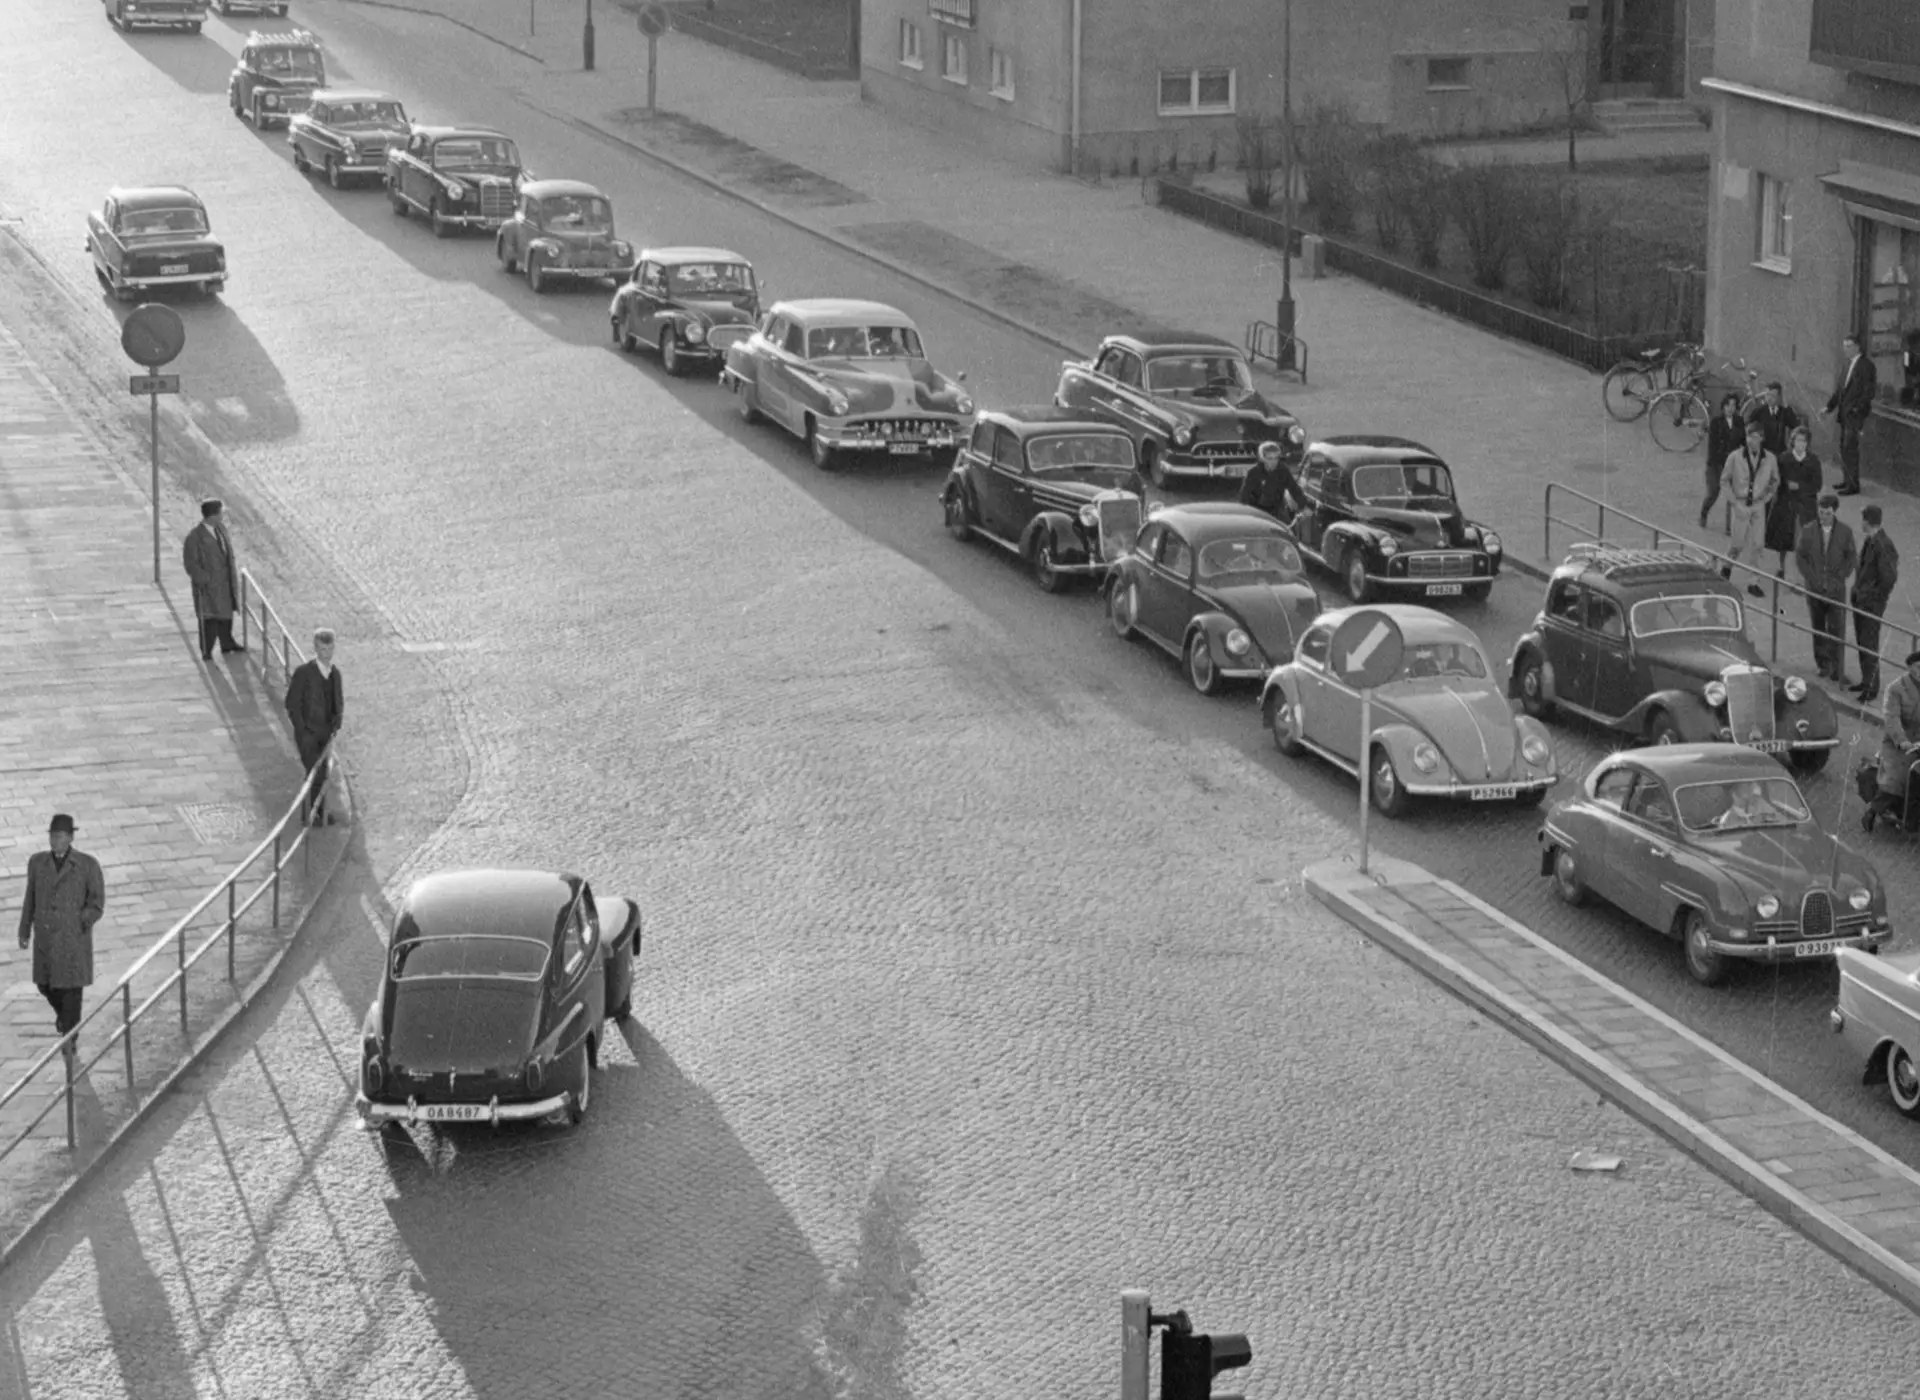
Between 1950 and 1970 the car's transport volume grew by a factor of 13.5, from 3.9 to 52.7 billion passenger kilometres, while the railway's fell from 6.6 to 4.6.13 So the system has already been turned upside down once. This article counts how it looks now, and why the answer depends on which unit you count in.
The arc closes in today's figures. In 1950 the railway carried 3.2 times as much freight transport as the road.13 In 2025 the road carries 2.6 times as much as the railway.2, 11 So the relationship has turned round and then grown stronger, and it took roughly two generations.
The size of the system
Passenger transport in Sweden was about 141,000 million passenger kilometres in 2025, which works out at 13,271 kilometres per inhabitant.11, 12, 27 Car traffic alone carried 94,914 million passenger kilometres, or 67.4% of the total.11 Buses accounted for 9,727 million, cycling for 2,816 and walking for 2,061.11
Rail traffic carried 16,209 million passenger kilometres, of which the railway 13,897, the metro 1,707 and trams 605.11 Aviation stood at 10,658 million, 18% lower than in 2019, and shipping at 1,490 million, 22% below the 2019 level.11, 12
Freight transport was about 98,800 million tonne kilometres, or 9,321 tonne kilometres per inhabitant.11, 12, 27 Lorries carried 51,958 million, shipping 26,533 and the railway 20,324.11 Aviation carried 35 million tonne kilometres, less than a twentieth of a per cent, while 142,000 tonnes of goods were flown to and from Swedish airports.11, 21
Two ways to count a journey
The share of journeys and the share of distance
The travel survey by Transport Analysis reports both the number of main journeys and their distance.1 A main journey can be made up of several legs.1, 14 The main mode of travel is the one used for the longest stretch.1
In 2025 walking accounted for 14.7% of main journeys and cycling for 12.5%.1 Other modes, which include air travel, taxis, mobility services for disabled people and boats, among others, accounted for 2.3%.1
Counted by distance, walking accounted for 1.1%, cycling for 2.4% and other modes for 5.1%.1 The shares are worked out from the survey's totals for the population aged 6 to 84.1
was the average length of a main journey on foot in 2025. The survey covers the population aged 6 to 84.
SOURCE: TRANSPORT ANALYSIS, TRAVEL SURVEY 2025, TABLE 1How long journeys are on average
A main journey on foot was on average 2.1 kilometres.1 For other modes the average was 63 kilometres.1 The number of journeys and their length answer different questions about travel.
According to the survey's point estimates, 3.8 billion main journeys were made in Sweden in 2025, a fall of 1.9% on the year before.1, 14 Main journeys on foot rose by 12% to 560 million, car journeys fell by 5% to 1,946 million, and main journeys by public transport stood at 707 million.1, 14 Transport Analysis says the changes are within the margin of error.14 A person aged 6 to 84 made on average 1.08 main journeys and travelled 32 kilometres a day.1
Three counts, the same winner
The same applies when the modes of transport are set against each other. Road traffic carries 79.9% of passenger transport and 52.6% of freight transport, and accounts for 71.6% of the transport sector's energy use.11, 12, 22 Rail traffic carries 11.5% of passenger kilometres and 20.6% of tonne kilometres, but uses 2.6% of the energy.11, 22
Rail traffic is the clearest illustration. Four ways of counting the same mode give four completely different figures: 11.5% of passenger kilometres, 20.6% of tonne kilometres, 2.6% of the energy and 0.2% of greenhouse gas emissions from domestic transport.11, 22, 24 None of the figures is wrong.
On the freight side there is also a player that barely shows in passenger traffic. Shipping carries 26.8% of freight transport, which makes it the second largest, but only 1.1% of passenger transport.11, 12
Domestic and international freight also look different. Of the 62,500 million tonne kilometres carried within Sweden, lorries accounted for 68%, the railway for 20 and shipping for 12.11 Of the 34,900 million international, counted without road transit through the country, shipping accounted for 55% and lorries for 23.11
Public transport's two answers
Why the two figures differ
The question of how many public transport journeys were made in Sweden in 2025 has two correct answers, and they differ by roughly a factor of two.1, 16
The travel survey reports 707 million journeys by public transport.1 The statistics on regional scheduled services report 1,499.9 million boardings in subsidised services.3, 16 Both figures come from the same agency and the same year.
The difference is not a counting error. A main journey can include several boardings, and the two products measure different things: one the travel of the population aged 6 to 84, the other the traffic reported by the regional public transport authorities.1, 15 A journey and a boarding are not the same thing.
Sweden in a wider context
Seen in a wider context, the Swedish transport sector is small. The world's transport used 124.5 exajoules of energy in 2024, about 34,600 terawatt hours, of which 90.1% was oil.8, 29 Sweden accounted for 0.31% of that.8, 22, 29
Compared with other European countries, Swedes travel roughly like the average. For 2024 Eurostat says the train accounted for 9.4% of passenger transport in Sweden against 7.5% in the EU, the car 67.3 against 69.2% and air travel 15.2 against 15.8%.7, 26
The vehicles and the distances driven
At the turn of 2025 and 2026 there were 5,039,000 cars, 628,000 light lorries, 86,000 heavy lorries and 15,000 buses in use in Sweden.4, 19 Nine per cent of cars in use run on electricity only, and the average age of a car is 12.1 years.18
Traffic on Swedish roads was 85,160 million vehicle kilometres in 2025, against 64,310 million in 1990, a rise of 32.4% in 35 years.20 Cars accounted for 80.8% of that, and lorries over 26 tonnes for 4.8%.20
A car registered in Sweden was driven on average 1,243 Swedish miles in 2025 (a Swedish mile is 10 kilometres).4, 17 The difference between fuels is large: a plug-in hybrid was driven 1,724 Swedish miles, an electric car 1,671, a diesel car 1,462 and a petrol car 941.17 A taxi was driven 6,176 Swedish miles.17
The empty seat
Subsidised regional scheduled services offered 106,384.5 million seat kilometres in 2025.3, 16 Passengers used 15,450.9 million of them, or 14.5%.16 Counted only against seated-place kilometres, leaving out standing room, the share is 24.5%.16
The figure is structural, not a judgement. Public transport is sized for the rush hour and so has to run with empty seats for most of the day, in the same way that a road is built for peak flow and stands half empty at night.
Public transport is also unevenly spread across the country. Boardings came to 141 per inhabitant nationally in 2025, but 296 in Stockholm County and 16 on Gotland.15 Stockholm County alone accounted for 49.9% of the country's boardings.15, 16
Air travel is counted in passengers rather than journeys. In 2025 just under 31 million passengers travelled to and from Swedish airports, of whom 4 million domestic and 27 million international.21 International rail travel rose at the same time for the third year in a row, to 780 million passenger kilometres.11
Energy and emissions
The transport sector's energy use was 106.92 terawatt hours in 2024, of which 82.30 domestic and 24.62 international.5, 22 By mode of transport, road traffic used 76.60 terawatt hours, shipping 19.79, aviation 7.71 and rail traffic 2.81.22
The difference in energy sources is the sharpest in the whole system. Rail traffic got 95.1% of its energy from electricity in 2024, while road traffic got 2.6%.22 In absolute terms rail traffic used 2.68 terawatt hours of electricity and road traffic 2.00, even though road traffic uses twenty-seven times as much energy in total.22
Electricity use in road transport is growing fast from a low level. It was 50.4 gigawatt hours in 2016, 313.5 gigawatt hours in 2020 and 1,999.4 gigawatt hours in 2024, of which cars accounted for 1,754.9.23 The Swedish Environmental Protection Agency says 10% of traffic was driven by electric vehicles in 2025, against 8% in 2024.6, 25
Emissions follow energy, not transport volume. Domestic transport emitted 16,848 kilotonnes of carbon dioxide equivalent in 2024.6, 24 Road traffic accounted for 15,884 kilotonnes, or 94.3%, and the railway for 36 kilotonnes, or 0.2%, even though the railway carries a fifth of freight transport.11, 24
What the figures do not say
The most important limit concerns history. The series on transport volume from 1950 to 2002 and the series from 2000 onwards are calculated with different models, and Transport Analysis writes explicitly that they are not comparable.2 The figures from the 1950s in this article should therefore be read as a description of the system at that time, not subtracted from today's.
Counted per inhabitant, passenger transport went from about 2,600 kilometres a year in 1950 to about 8,900 kilometres in 1970 and 13,271 kilometres in 2025.11, 13, 27, 28 The first two figures come from the old series and the last from the new one.2, 13
The energy side contains a figure that moves fast: the amount of biofuel in the transport sector fell from 19.6 to 10.9 terawatt hours between 2023 and 2024.5, 23 The figure is measured, but every explanation of why lands in rules and politics, and this article describes the system, not the decisions about it.
All the episodes in this area are on Season 3, Rapid Urbanization.
What to take away
Passenger transport was about 141,000 million passenger kilometres in 2025, of which the car 67.4%, and freight transport 98,800 million tonne kilometres, with lorries 51,958, shipping 26,533 and the railway 20,324.11, 12 Road traffic uses 71.6% of the sector's energy, rail traffic 2.6.11, 22 That this moves slowly shows in the structure: a car in use is on average 12.1 years old, and the modes of transport were built for peak flow, so the shares change at the pace of the vehicle fleet rather than the pace of decisions.18 Three figures are published regularly and can be followed: Transport Analysis's transport volumes and travel survey, Transport Analysis's boardings in regional scheduled services, and the Swedish Energy Agency's energy use by mode of transport.1, 3, 5, 11
Education, not advice.
The fund
Behind the library stands a fund.
Own The Future is published by AIX. The library is the knowledge; AIX Dynamic is the tool, a systematic securities fund (UCITS) that follows the trend and steps aside when risk rises.
This is marketing. Fund units can both rise and fall in value. Read the key information document (KID) and the prospectus before you invest; you will find them on the fund's page at Avanza.
34 UNITHOLDERS · AS OF 15 SEP 2026The future in your inbox.
The most important things from each area, without the noise and without the hype.
Sources
- Transport Analysis (Trafikanalys), Resvanor i Sverige 2025, tabell 1 och 2 (Travel habits in Sweden 2025, tables 1 and 2). The year 2025, all purposes and both sexes; the population aged 6 to 84. Shares worked out from the totals in table 1, including answers missing. The main journey's mode of travel is the one used for the longest stretch.
- Transport Analysis (Trafikanalys), statistiken över transportarbete (the statistics on transport volumes). Passenger transport in passenger kilometres and freight transport in tonne kilometres by mode of transport, and the older series Transport volumes 1950 to 2002 with the agency's own warning that the series are not comparable.
- Transport Analysis (Trafikanalys), statistiken över regional linjetrafik (the statistics on regional scheduled services). The number of boardings, seat kilometres and passenger kilometres in subsidised services in 2025.
- Transport Analysis (Trafikanalys), statistiken över körsträckor och fordon i trafik (the statistics on distances driven and vehicles in use). The vehicle fleet at the turn of the year, average distances driven by fuel and traffic on Swedish roads from 1990 to 2025.
- Swedish Energy Agency (Energimyndigheten), energistatistiken (the energy statistics). The transport sector's energy use by energy source and mode of transport, and the amount of biofuel in 2023 and 2024.
- Swedish Environmental Protection Agency (Naturvårdsverket), statistiken över territoriella utsläpp av växthusgaser (the statistics on territorial greenhouse gas emissions). Emissions from domestic transport by mode of transport.
- Eurostat, transportstatistiken (the transport statistics), passenger transport and domestic freight transport by mode of transport. The comparison between Sweden and the EU for 2024.
- International Energy Agency, energistatistiken (the energy statistics), the world's energy use in the transport sector in 2024. The denominator in the comparison with the size of the Swedish sector.
- Statistics Sweden (SCB), Statistikdatabasen, Folkmängden efter ålder och kön (statistical database, population by age and sex). The denominator in the figures per inhabitant.
- Bohuslän Museum (Bohusläns museum), samlingsposten UMFA53240:009924 (collection record UMFA53240:009924) on DigitaltMuseum. The photograph from Uddevalla in 1960, licence Public Domain Mark.
- Transport Analysis (Trafikanalys), Transportarbete i Sverige 2000 till 2025 (Transport volumes in Sweden 2000 to 2025), table appendix, Statistics 2026:27, 3 Jul 2026. Supports passenger transport in 2025 by mode and sub-mode (car 94,913.9, bus 9,726.5, cycling 2,816.4, walking 2,061.4, rail traffic 16,209.4 with railway 13,897.4, metro 1,707 and tram 605, aviation 10,658.3, shipping 1,489.9), freight transport in 2025 (road 51,957.5, shipping 26,533.3, railway 20,323.9, aviation 35.0), the split into domestic and international for road, railway, shipping and aviation, and the railway's international passenger kilometres of 780.1 and their rise three years in a row.
- Transport Analysis (Trafikanalys), Transportarbete i Sverige 2000 till 2025 (Transport volumes in Sweden 2000 to 2025), statistical bulletin, Statistics 2026:27, 3 Jul 2026. Supports the totals of 141,000 million passenger kilometres and 98,800 million tonne kilometres in 2025, that aviation's passenger kilometres are 18% lower than in 2019, and the agency's own summary table of the shares of each mode.
- Transport Analysis (Trafikanalys), Transportarbete 1950 till 2002 (Transport volumes 1950 to 2002), table appendix, 16 Sep 2015. Supports the figures for 1950 (car 3.87 and railway 6.6 billion passenger kilometres, total rail traffic 7.6, road 2.7 and railway 8.64 billion tonne kilometres, a total of 18.28 billion passenger kilometres), 1953 (car 7.46 against total rail traffic 7.2), 1967 to 1969 as the three years when road and railway were level on the freight side, 1970 (car 52.74, railway 4.6, a total of 71.66 passenger kilometres, and road 17.5 against railway 17.31 tonne kilometres), and that the car first overtakes all rail traffic in 1953.
- Transport Analysis (Trafikanalys), Den nationella resvaneundersökningen 2025 (The national travel survey 2025), statistical bulletin, Statistics 2026:17, 28 May 2026. Supports the 3.8 billion journeys in 2025, the fall of 1.9%, the 12% rise in journeys on foot, the 5% fall in car journeys, that public transport journeys stayed at the 2024 level, and the agency's statement that the changes by mode are within the margin of error.
- Transport Analysis (Trafikanalys), Regional linjetrafik 2025 (Regional scheduled services 2025), statistical bulletin, Statistics 2026:24, 26 Jun 2026. Supports 141 boardings per inhabitant nationally, 296 in Stockholm County and 16 in Gotland County in 2025, that Stockholm County accounts for half of the country's boardings, and that the statistics cover the traffic reported by the regional public transport authorities.
- Transport Analysis (Trafikanalys), Regional linjetrafik 2025 (Regional scheduled services 2025), table appendix, Statistics 2026:24, 27 Jun 2026. Supports table 1a: 1,499,864.6 thousand boardings, 15,450,911.1 thousand passenger kilometres, 106,384,507.0 thousand seat kilometres and 63,085,927.7 thousand seated-place kilometres in subsidised services in 2025, and Stockholm County's 748,101 thousand boardings.
- Transport Analysis (Trafikanalys), Körsträckor 2025 (Distances driven 2025), table appendix, Statistics 2026:10, 17 Apr 2026. Supports the average distance driven of 1,242.7 Swedish miles in 2025, the distances by fuel (plug-in hybrid 1,724.4, electric 1,671.2, diesel 1,461.9, petrol 940.6) and the taxis' 6,175.5 Swedish miles.
- Transport Analysis (Trafikanalys), Fordon 2025 (Vehicles 2025), statistical bulletin, Statistics 2026:3, 19 Feb 2026. Supports that 9% of cars in use run on electricity only and that a car in use was on average 12.1 years old in 2025.
- Transport Analysis (Trafikanalys), Fordon 2025 (Vehicles 2025), table appendix, Statistics 2026:3, 19 Feb 2026. Supports vehicles in use at the end of 2025: 5,039,431 cars, 627,910 light lorries, 86,125 heavy lorries and 14,528 buses, and 432,709 fully electric cars.
- Transport Analysis (Trafikanalys), Trafikarbete på svenska vägar 1990 till 2025 (Traffic on Swedish roads 1990 to 2025), table appendix, 17 Apr 2026. Supports 85,159.7 million vehicle kilometres in 2025 against 64,309.7 million in 1990, the cars' 68,778.2 and the heavy lorries over 26 tonnes' 4,062.0.
- Transport Analysis (Trafikanalys), Luftfart 2025 (Aviation 2025), statistical bulletin, Statistics 2026:9, 13 Apr 2026. Supports the just under 31 million passengers in 2025 with 4 million domestic and 27 million international, and the 142,000 tonnes of air freight.
- Swedish Energy Agency (Energimyndigheten), statistical database, the tables Energianvändning i transportsektorn uppdelad på inrikes och utrikes transporter samt bränsleslag (Energy use in the transport sector split into domestic and international transport and type of fuel) and Energianvändning i transportsektorn uppdelad på transportslag samt bränsleslag (Energy use in the transport sector split into mode of transport and type of fuel). Supports for 2024 a total of 384,916 terajoules (106.92 terawatt hours) with 296,290 domestic (82.30) and 88,625 international (24.62), and by mode road 275,764 (76.60), shipping 71,261 (19.79), aviation 27,757 (7.71) and rail traffic 10,133 (2.81), with electricity at 9,632 terajoules in rail traffic and 7,198 in road traffic.
- Swedish Energy Agency (Energimyndigheten), statistical database, the tables Biodrivmedelsanvändningen inom transportsektorn (inrikes), TWh (Biofuel use in the transport sector, domestic, TWh) and Modellerad elanvändning inom vägtransporter, GWh (Modelled electricity use in road transport, GWh). Supports biofuels at 19.6 terawatt hours in 2023 and 10.9 terawatt hours in 2024, and electricity use in road transport of 50.35 gigawatt hours in 2016, 313.50 in 2020 and 1,999.38 in 2024, of which cars 1,754.88.
- Statistics Sweden (SCB), statistical database, Utsläpp av växthusgaser från inrikes transporter efter växthusgas, transportslag, bränsleslag och år (Greenhouse gas emissions from domestic transport by greenhouse gas, mode of transport, type of fuel and year). Supports for 2024 domestic transport in total 16,847.9 kilotonnes of carbon dioxide equivalent, road traffic 15,884.2, railway 36.4, shipping 657.9 and aviation 269.4.
- Swedish Environmental Protection Agency (Naturvårdsverket), Inrikes transporter, utsläpp av växthusgaser (Domestic transport, greenhouse gas emissions), reviewed 17 Jun 2026. Supports that electric vehicles' share of total traffic was 10% in 2025, a rise of 2 percentage points on 2024.
- Eurostat, Modal split of air, sea and inland passenger transport (tran_hv_ms_psmod), updated 26 Aug 2026. Supports for 2024 train 9.4% in Sweden against 7.5 in the EU27, car 67.3 against 69.2 and air 15.2 against 15.8.
- Statistics Sweden (SCB), statistical database, Folkmängden efter region, ålder (utökade åldersgrupper) och kön, år 2025 (Population by region, age, extended age groups, and sex, year 2025). Supports the denominator of 10,605,529 inhabitants nationally on 31 Dec 2025, and Stockholm County 2,486,251 and Gotland County 60,852.
- Statistics Sweden (SCB), statistical database, Folkmängden efter ålder och kön, år 1860 till 2024 (Population by age and sex, years 1860 to 2024). Supports the denominators of 7,041,829 inhabitants in 1950 and 8,081,229 inhabitants in 1970.
- International Energy Agency, Energy Statistics Data Browser, the world energy balance, final consumption in the transport sector. Supports the order of magnitude and the share of oil; the freely available world balance ends in 2023 with 122,904,119 terajoules in the transport sector, of which oil and oil products 110,782,770 terajoules, or 90.14%.
- National Library of Sweden (Kungliga biblioteket), Dagen H (H Day, the switch to driving on the right), digital exhibition. Supports that the switch to right-hand traffic took place at 05.00 on 3 Sep 1967.
Links retrieved 9 Sep 2026.
Extended on 13 Sep 2026 with Transport Analysis's table appendices and statistical bulletins behind the 2025 figures, the older series on transport volumes from 1950 to 2002, the Swedish Energy Agency's statistical database, Statistics Sweden's table of emissions from domestic transport, Eurostat's table of modal split, Statistics Sweden's population figures as the denominator and the National Library of Sweden's information on the switch to right-hand traffic. Transport Analysis's summary table gives road traffic's share of freight transport as 52.5% and rail traffic's as 20.5%. The article follows the exact figures in the table appendix, 52.6% and 20.6%.