OWN THE FUTURE · SEASON 4 · CLIMATE & RESOURCE SCARCITY
What happens to our rubbish, and how much is recycled?
A circular economy means that materials are used again instead of being thrown away. We follow what happens to our rubbish and which parts are recycled.
Published 10 Sep 2026 · About 11 minutes to read
In 1898 Stockholm's rubbish was taken by rail out to Lövsta and unloaded on an embankment above an enclosure.8 Below the embankment, about a hundred pigs grazed on the heap.8 The food waste became feed, and the feed became food again. It was a circular economy before the term existed, and it was not pleasant.
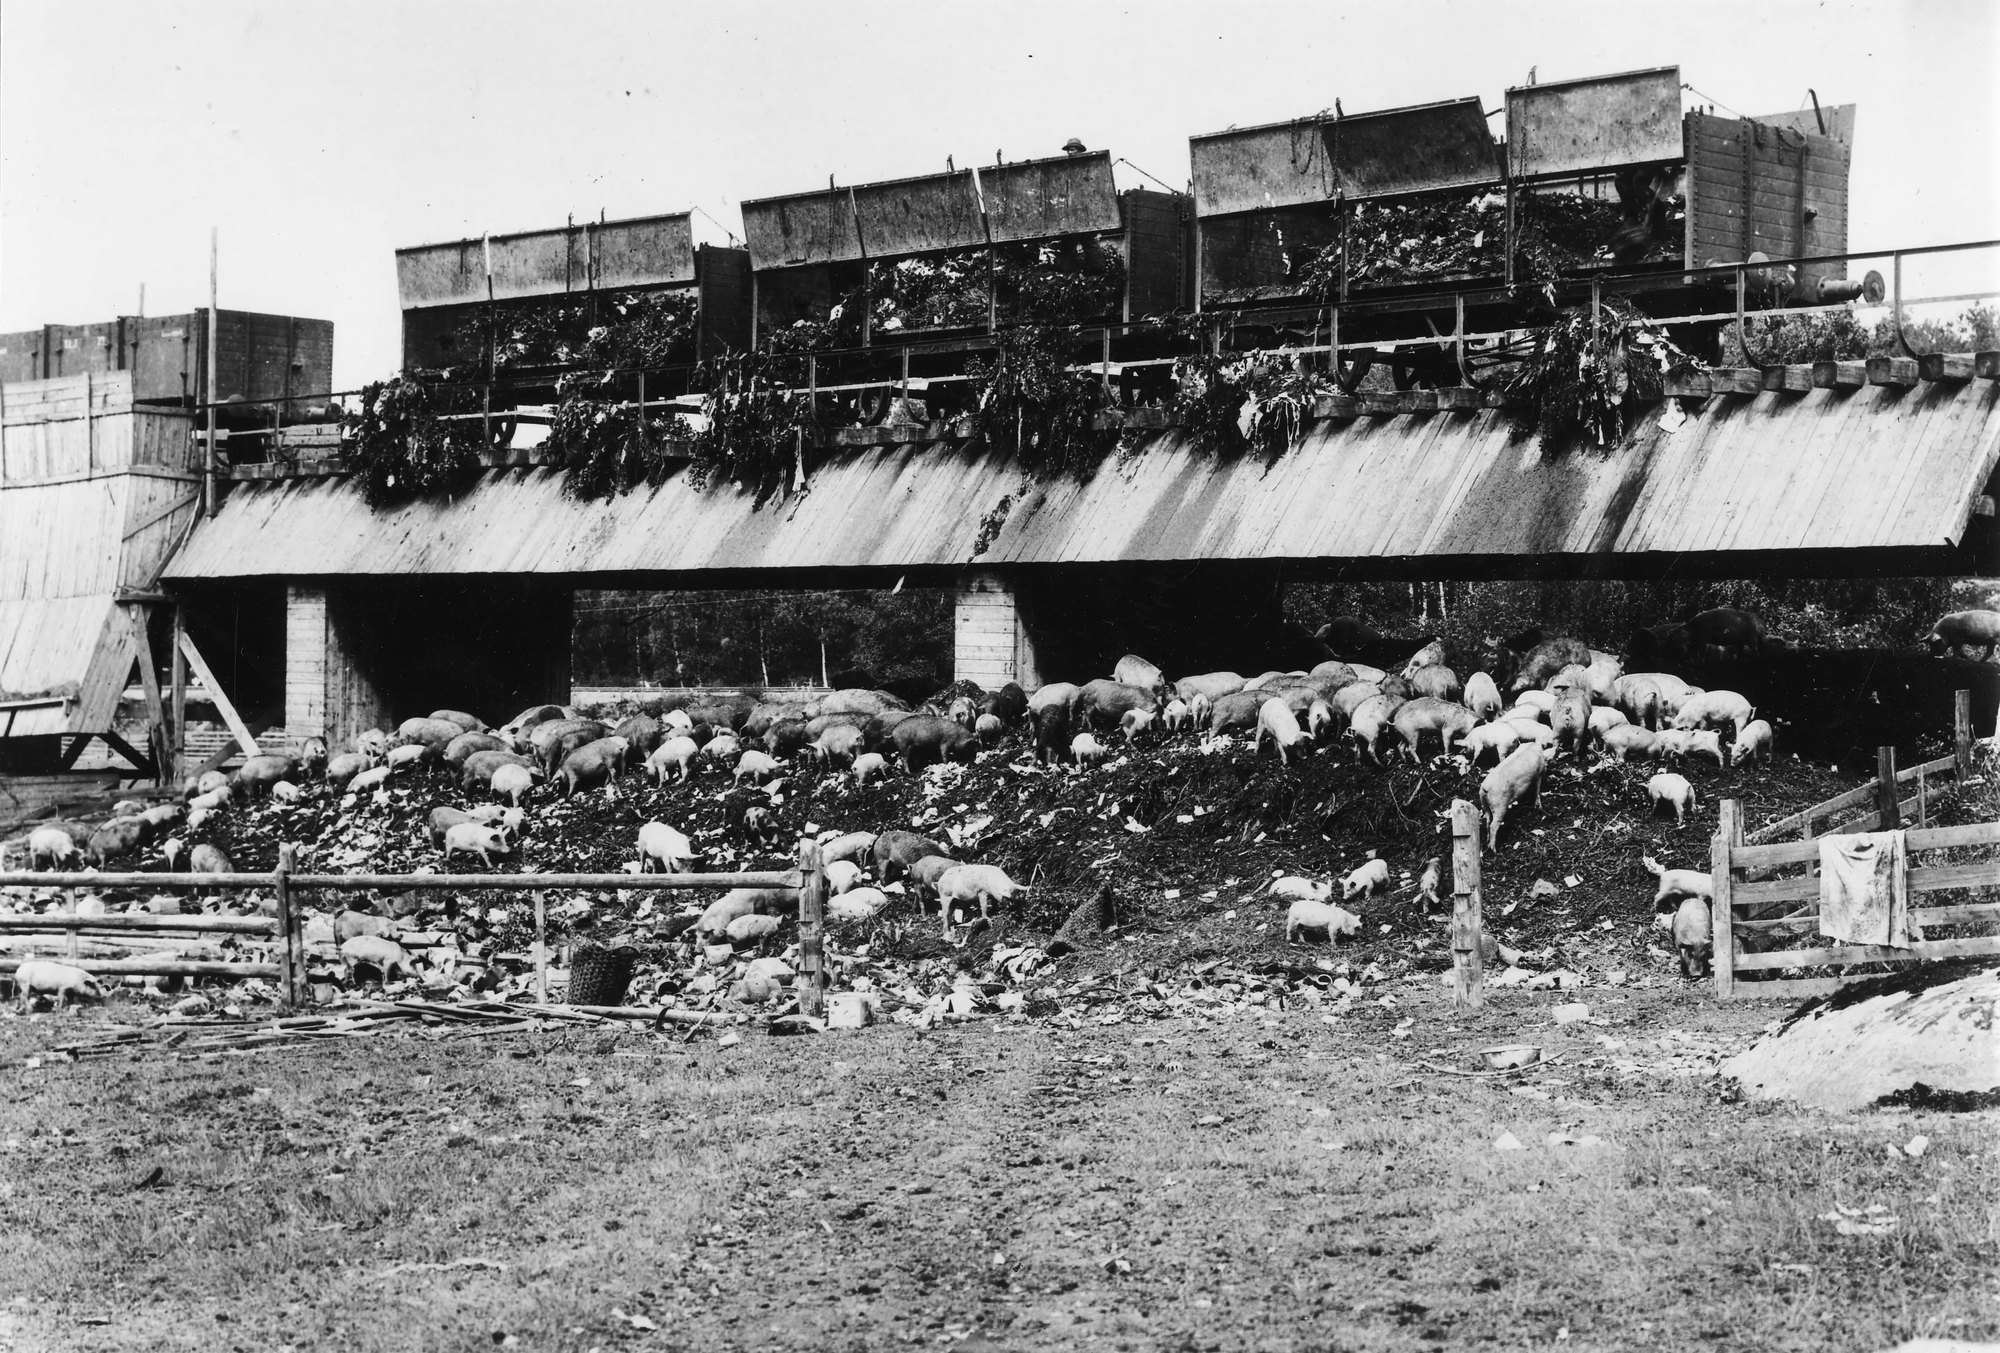
This article follows what happens to our rubbish today, and works out how much actually becomes new material. What waste incineration gives back in the form of electricity and heat is counted in S4:E1 Clean Energy.
The order the law sets
The Swedish Environmental Code (Miljöbalken) sets out the order in which waste must be treated. Whoever is responsible for the treatment must first prepare the waste for reuse, second recycle it as material, third recover it in some other way, and last of all dispose of it.9 The step before those four, preventing the waste from arising at all, comes earlier in the same code.9
Two definitions from the legal text make the rest of the article precise. To recycle waste as material means to reprocess it into new substances or objects that are not to be used as fuel or as filling material.9 So incineration is by definition not material recycling, however much energy is recovered. Reuse means that a product that is not waste is used again for the same purpose.9 Passing on a working chair is reuse. Grinding it down into chipboard is material recycling.
Two figures, forty times apart
Municipal waste and total waste
The figure most people recognise is municipal waste. Sweden generated 428 kilos per inhabitant in 2024.2 The category is wider than the household rubbish bag and includes, among other things, sorted waste and similar waste from businesses.2, 9
The figure almost nobody mentions is total waste. In 2024, 181,521,400 tonnes of waste arose in Sweden, that is 17.1 tonnes per inhabitant.1, 7 Municipal waste is about 2.5% of the total amount of waste.1, 2
Mining waste dominates both tables
The difference is mostly rock. The mining and quarrying sector produced 139,301,000 tonnes, that is 76.7% of all waste in the country, and nearly all of it is waste rock and tailings that are stored in tailings ponds and on waste rock heaps at the mine.1 Construction came second with 16,279,000 tonnes.1
For the country as a whole the picture looks completely different. Of the 180,479,400 tonnes of waste treated in 2024, 37.3% went to landfill and 33.6% to other disposal.1 Conventional material recycling accounted for 2.4% and incineration with energy recovery for 4.6.1
That table looks like a failure and is in practice a description of mining. In the category of other disposal, too, 60,551,000 of 60,561,000 tonnes were mineral waste.1
Nearly everything that goes to landfill is rock
Of the waste treated in Sweden in 2024, 67,407,000 tonnes went to landfill, that is more than a third.1 That sounds like a failing grade for Swedish waste management, and it is not.
Of the 67,407,000 tonnes, 67,015,000 tonnes were mineral waste, that is 99.4%.1 The non-mineral waste that went to landfill was 392,000 tonnes, about 37 kilos per inhabitant per year.1, 7 In practice none of the municipal waste goes to landfill: Eurostat gives 3 kilos per inhabitant for Sweden in 2024 in the category of landfill and other disposal, against 110 kilos in the EU as a whole.5
So Sweden sends more than a third of its waste to landfill counted by weight, nearly all of it is rock from the mines, and three kilos of municipal waste per person per year goes to landfill.1, 5
Where municipal waste goes
For municipal waste there is a complete flow. Of the 4,535,000 tonnes treated in 2024, 46.7% went to material recycling or preparation for reuse, that is about 2,118,000 tonnes.2 52.6%, about 2,385,000 tonnes, went to energy recovery, and 0.7% to other treatment.2
So just under half of municipal waste becomes new material and just over half becomes district heating and electricity.2 Where that electricity goes is counted in the first episode in this area.
Collected is not recycled
Almost every conversation about recycling mixes up two things: putting something in the right bin, and the material actually becoming new material. The Swedish Environmental Protection Agency's (Naturvårdsverket) flow chart for 2024 makes the difference measurable, and wood is the clearest proof.2
All separately collected wood waste in the municipal flow in 2024, that is 123,000 tonnes, went to energy recovery.2 Zero tonnes were recycled as material. The collection rate was one hundred per cent and the material recycling rate zero.2
The same gap exists in milder form everywhere. Electrical equipment was collected at 95.8% and recycled as material at 72.0.2 Batteries 95.8 and 79.2% respectively. Plastic 51.4 and 31.1 respectively. Food waste 54.1 and 50.4 respectively. Garden and park waste 89.6 and 54.3 respectively.2 The gap is smallest for glass: 86.4% collected and 82.6% recycled as material.2
Glass also shows why the material matters. Glass is uniform, is sorted into two colours and is melted down into new glass.3, 10 Plastic is not one single material but a family of materials, and the EU calculation rule requires it to be separated by polymer before it counts as recycled.3
Textiles are the biggest gap. In 2024, 72,000 tonnes of textile waste arose and 18,000 tonnes were collected separately.2 The requirement for separate collection of textiles came in on 1 Jan 2025 and so does not show in that year's figures.6, 11
When the figure is 99%, the denominator is wrong
In 2024, 99% of the paper packaging and 98% of the glass packaging placed on the Swedish market was recycled as material.2 That sounds like a perfect system.
The Swedish Environmental Protection Agency itself writes that it is more of a warning sign. A material recycling rate close to one hundred per cent suggests that the reported amount placed on the market is underestimated, since both glass and paper also end up in the residual waste that goes to incineration.2 One cause the agency points to is producers who do not report what they place on the market.2
The proof is in the same table. 229,447 tonnes of glass packaging were collected in 2024, while only 222,064 tonnes were reported as placed on the market.2 More was collected than was sold. For paper, the result is a negative figure in the agency's own table, that is minus 7,550 tonnes of paper packaging in residual waste.2
The Swedish Environmental Protection Agency therefore adjusts the amount placed on the market upwards using waste composition analyses. Glass then falls from 98 to 83%, paper from 99 to 82, and the total from 76 to 66.2 The agency adds that even the adjusted figures are probably underestimated.2
The caveat applies to these figures and not to recycling measures in general. For glass and paper packaging in 2024, the Swedish Environmental Protection Agency warns that the reported amount placed on the market may be underestimated, which can make the calculated recycling rates too high.2 The agency that publishes the figure says so itself.
The method that changed in 2020
The material recycling rate reported for plastic packaging in Sweden was 53.2% in 2019.12 Two years later it was 23.8%.12 The change of method means that the recycling rates before and after the change cannot be compared directly.
Where recycling is measured
The method changed. The Commission's implementing decision of 7 Jun 2019 established that, as a main rule, material recycling is to be measured at the point where the waste enters the recycling operation itself, not when it is collected.3 The decision applies from the reference year 2020.2, 3
The calculation points are strikingly concrete. Glass counts when the sorted glass enters a glass furnace, metal when it enters a smelter, paper when it enters a pulping process, plastic when it has been separated by polymer and goes on to pelletising or moulding, and wood when it goes to chipboard production or composting.3 Everything that drops out between the bin and the furnace is therefore not counted.
The effects of the change
The result is that figures from before 2020 and figures from 2020 onwards must never be put in the same time series without the break being spelled out. Statistics Sweden (SCB) has solved this by putting the statistics in three separate tables.13
The same decision contains a twist worth knowing about. Metal separated from the bottom ash after incineration may be counted as recycled as material, using a special method.3 That explains why metal is the only type of material in the municipal flow chart where the amount recycled, 179,000 tonnes, is larger than the amount collected separately, 172,000 tonnes.2
How far the circle closes
Everything above is about waste. The question in the episode's title is about something bigger: how much of the material that society uses comes from material that has already been in circulation.
of the Swedish material flow in 2024 came from material that had already been in circulation. The corresponding figure for the EU was 12.2%.
SOURCE: EUROSTAT, CIRCULAR MATERIAL USE RATEA country that sends three kilos of municipal waste per person per year to landfill, and that collects 86% of its glass, still takes about nine tenths of the material it uses from new extraction.2, 4, 5 Counted per inhabitant, Sweden uses about 22.8 tonnes of material a year.14
The difference between the two pictures is not a contradiction. Waste statistics measure what happens to what has already become waste. The circular material use rate in the economy measures how large a share of the whole material flow that waste makes up, and that flow is dominated by building materials, ore, sand, gravel and biomass, which are not recycled to the same extent as glass jars.
What the figures do not say
Four years' worth of figures are in circulation at the same time. The figures for 2024 have only been in the statistical database since 15 Jun 2026, while the agency's own summary pages still describe 2022, when the total was about 164 million tonnes.1, 15, 16 Mixing the two up is the easiest source of error in the subject.
There is a second break in method in municipal waste, where the material recycling rate went from 39 to 47% between 2023 and 2024 because of changed reporting and not only because of changed behaviour.2
And waste generated and waste treated are two different measurements that the agency itself advises against comparing directly, since waste can be stored, imported and exported between the two points.17
All the episodes in this area are on Season 4, Climate & Resource Scarcity.
What to take away
In 2024, 428 kilos of municipal waste per inhabitant arose, and of the municipal waste treated, 46.7% went to material recycling and 52.6% to energy recovery.2 At the same time, 181,521,400 tonnes of waste arose in the whole country, with mining and quarrying accounting for 76.7%.1 The structure explains why 10.4% of the material flow in 2024 came from material that had already been in circulation: the flow is dominated by ore, sand, gravel, building materials and biomass, and the EU only counts material recycling when the waste enters the recycling operation.3, 4 Follow the Swedish Environmental Protection Agency's statistics sheet on municipal waste, the Statistics Sweden and Swedish Environmental Protection Agency tables on waste generated and treated, and Eurostat's measure, the circular material use rate.1, 2, 4
Education, not advice.
The fund
Behind the library stands a fund.
Own The Future is published by AIX. The library is the knowledge; AIX Dynamic is the tool, a systematic securities fund (UCITS) that follows the trend and steps aside when risk rises.
This is marketing. Fund units can both rise and fall in value. Read the key information document (KID) and the prospectus before you invest; you will find them on the fund's page at Avanza.
34 UNITHOLDERS · AS OF 15 SEP 2026The future in your inbox.
The most important things from each area, without the noise and without the hype.
Sources
- Statistics Sweden (SCB) and the Swedish Environmental Protection Agency (Naturvårdsverket), Statistical Database (Statistikdatabasen), waste statistics, published 15 Jun 2026. The table Uppkommet avfall efter egenskap, näringsgren SNI 2007 och avfallsslag (MI0305T01C) (Waste generated by property, industry SNI 2007 and type of waste), with the selection property total, type of waste Total, all nineteen industries including households, 2024, gives the total of 181,521,400 tonnes and the split by sector. The table Behandlat avfall efter typ av behandling och avfallsslag (MI0305T003) (Waste treated by type of treatment and type of waste), with the selection property total, type of treatment Landfill, type of waste Total, 2024, gives the 67,407,000 tonnes and the mineral share of them. The table paths in the open data are MI/MI0305/MI0305T01C and MI/MI0305/MI0305T003.
- Swedish Environmental Protection Agency, Statistikblad: Kommunalt avfall 2024 (Statistics sheet: municipal waste 2024), 2 pages, dated 20 Feb 2026 with an amendment on 16 Mar 2026, and the web page Kommunalt avfall (Municipal waste), reviewed 30 Apr 2026. The flow chart in the statistics sheet gives the amounts generated, separately collected and recycled as material by type of material; the collection rates and material recycling rates in the article are the editors' own divisions of the second and third columns respectively by the first. The web page gives 4.5 million tonnes, 428 kilos per person, 47% material recycling and the agency's own explanation that the rise on 2023 is mainly due to changed reporting. Swedish Environmental Protection Agency, Sveriges återvinning av förpackningar 2024 (Sweden's recycling of packaging 2024), 6 pages, December 2025. The table on pages 4 and 5 gives 222,064 tonnes of glass packaging placed on the market against 229,447 tonnes collected and 98% material recycling; the warning that a rate close to one hundred per cent suggests that the amount placed on the market is underestimated is on page 3.
- European Commission, genomförandebeslut (EU) 2019/1004 (Implementing Decision (EU) 2019/1004, Swedish language version) of 7 Jun 2019, Annex I. The calculation points by type of material and the rule on metal from bottom ash.
- Eurostat, circular material use rate. The figures of 10.4% for Sweden and 12.2% for the EU in 2024.
- Eurostat, municipal waste by waste management operations. The 3 kilos of municipal waste sent to landfill per inhabitant in Sweden against 110 kilos in the EU.
- The Swedish Parliament (Sveriges riksdag), avfallsförordningen (2020:614) (the Waste Ordinance) and the Environmental Code. The waste hierarchy and the requirements for separate collection, including textiles from 1 Jan 2025.
- Statistics Sweden, Statistical Database, the table Folkmängden efter ålder och kön (BefolkningR1860N) (Population by age and sex). Selection: all ages, both sexes, 2024. The total of 10,587,710 inhabitants on 31 Dec 2024 is the denominator. The table path in the open data is BE/BE0101/BE0101A/BefolkningR1860N.
- Swedish Railway Museum (Sveriges järnvägsmuseum), samlingsposten JvmKDCA00493 (collection record JvmKDCA00493) on DigitaltMuseum. The photograph from Lövsta in 1898, licence Public Domain Mark.
- The Swedish Parliament, Miljöbalk (1998:808) (the Environmental Code), Chapter 2 Section 5 and Chapter 15 Sections 5 and 11. Supports the four steps of the waste hierarchy, the waste prevention step before them, the definition of recycling waste as material, the definition of reuse and the definition of municipal waste.
- The Swedish Parliament, Förordning (2022:1274) om producentansvar för förpackningar (Ordinance on producer responsibility for packaging), Chapter 3 Section 4, Chapter 4 Section 2 and Chapter 5 Section 3. Supports that glass packaging is collected in two fractions, coloured and clear glass, and that the target for material recycling of glass is at least 90% a year.
- The European Parliament and the Council, Direktiv 2008/98/EG om avfall, konsoliderad version av den 18 februari 2024 (Directive 2008/98/EC on waste, consolidated version of 18 Feb 2024), Article 11.1. Supports that separate collection of textiles must be in place by 1 Jan 2025.
- Eurostat, Recycling rate of packaging waste by type of packaging (cei_wm020), extract for Sweden and plastic packaging. Supports 53.2% for 2019 and 23.8% for 2021 in Sweden's reporting to the EU.
- Statistics Sweden, Statistical Database, the subject area Waste, packaging (MI0307), the three tables Total tillförd och återvunnen mängd förpackningar efter förpackningsslag. År 2012 till 2019 (Total amount of packaging placed on the market and recycled by type of packaging, 2012 to 2019), samma tabell, ny beräkningsgrund från och med 2020, år 2020 till 2023 (the same table, new basis of calculation from 2020, 2020 to 2023) and samma tabell, år 2024 (the same table, 2024). Supports that the statistics are in three separate tables with the break at 2020.
- Eurostat, Material flow accounts (env_ac_mfa), domestic material consumption per inhabitant. Supports 22.8 tonnes of material per inhabitant in Sweden in 2024.
- Swedish Environmental Protection Agency, Avfall i Sverige 2022, uppkomst och behandling (Waste in Sweden 2022, generation and treatment), report 7161, September 2024 (PDF, 44 pages). Supports the total of 164 million tonnes for 2022 and the agency's explanation of the difference between waste generated and waste treated.
- Swedish Environmental Protection Agency, Avfallsbehandling i Sverige (Waste treatment in Sweden), web page reviewed 29 Aug 2025. Supports that the agency's summary page still describes 2022 and that the next round refers to 2024.
- Statistics Sweden and the Swedish Environmental Protection Agency, Avfall, uppkommet och behandlat (Waste, generated and treated), the statistics landing page, tables updated 15 Jun 2026. Supports that it is not recommended to compare amounts generated directly with amounts treated, the reason being imports and exports, and the publication date of 15 Jun 2026 for both tables.
Links retrieved 9 Sep 2026.
Extended on 13 Sep 2026 with the waste chapter of the Environmental Code, the ordinance on producer responsibility for packaging, the EU Waste Directive, Eurostat's packaging and material flow statistics, Statistics Sweden's three packaging tables, and the Swedish Environmental Protection Agency's report Waste in Sweden 2022 and the statistics landing page. The Swedish Environmental Protection Agency gives material recycling of municipal waste as 47% of the amount generated, while the flow chart gives 46.7% of the amount treated; the article follows the flow chart. The statistics sheet reports 123,000 tonnes of separately collected wood waste and 121,000 tonnes of wood to energy recovery, and itself explains the difference by differences in the available data on amounts collected and treated. Eurostat's figures of 3 and 110 kilos refer to the category of landfill and other disposal, and Eurostat gives 427 kilos of municipal waste per inhabitant for Sweden in 2024 against the Swedish Environmental Protection Agency's 428.