OWN THE FUTURE · SEASON 5 · EMERGING GLOBAL WEALTH
What is a capital market, and what separates a large one from a small one?
A capital market is where companies and governments borrow money and where shares change hands. We explain how such a market is built and what separates a large market from a small one.
Published 10 Sep 2026 · About 11 minutes to read
In 1815 the Swedish state unilaterally wrote off most of its foreign debt.9 Three quarters of the national debt had then been borrowed abroad.9 The last third of the national debt was paid later, and the Swedish province of Pomerania was pledged against payment in silver.9 By 1834 the national debt had been more or less wiped out.9 The Swedish National Debt Office, founded in 1789, describes this event itself on its website.9
From 1840 and into the 20th century, the Debt Office instead borrowed by issuing bonds abroad, and a large part of the money was lent on short term to Swedish banks.9 The Debt Office states that this was the beginning of the Swedish money market.9 In 1897 the Swedish Parliament decided that the Riksbank alone would be allowed to issue banknotes, and the decision took effect at the start of 1904.22 Only then could the bank conduct monetary policy in the modern sense.
This article goes through what a capital market consists of, how the Swedish one is built layer by layer, and what measurably separates a large market from a small one. There are no return figures, and no assessments of individual markets.
Two halves and two steps
A capital market has two halves. On the equity side, a company sells shares of itself, and the buyer becomes a part owner. On the debt side, a company, a municipality or a state borrows money against a promise to pay it back with interest, and the buyer becomes a lender. The relative size of the two sides depends on which markets and securities are counted, which often surprises people.
The market also has two steps. On the primary market the security is issued for the first time, and the money goes to whoever issues it. On the secondary market the same security changes hands between investors, and no money goes to the company or the state. The trading you see in the news is almost entirely the second kind.
Four layers
Beneath that trading lie four layers. The marketplace, registration and settlement, and supervision carry organised trading, and for some transactions a central counterparty is added.
The first is the marketplace, the place where buyers and sellers meet. It can be a regulated market, in everyday speech a stock exchange, or a trading platform with lighter rules.7, 30 The second is the central securities depository, which keeps the register of who owns what.32 The third is the central counterparty, which steps in between buyer and seller so that neither needs to trust the other.33 The fourth is supervision, which in Sweden is carried out by the Swedish Financial Supervisory Authority (Finansinspektionen).7
Counted in units, the Swedish infrastructure is small. The authority's company register shows two exchanges, two regulated markets, three trading platforms, one central securities depository, one central counterparty and two clearing organisations.7, 30 Alongside them there are 122 investment firms that pass on orders and manage capital.7, 30
The third and fourth layers are invisible to the person trading, and that is the point. A central counterparty takes over the counterparty risk from both sides, so that a trade does not depend on the other party being able to pay.33 A central securities depository makes ownership an entry in a register instead of a paper in a safe deposit box, which is why a trade can take seconds.32
What separates a large market from a small one
The number of listed companies is the first measure, and it easily misleads. In June 2026, 922 companies were listed on Swedish marketplaces.1 Of them, 378 were on a regulated market and 544 on a trading platform, 41.0% and 59.0% respectively.1
The value, and the size against the economy
The market value is spread completely differently. The shares in the 922 companies were worth 13,515,619 million kronor, and 98.2% of that value was on a regulated market.2 The trading platforms, where six in ten companies are listed, held 1.8%.1, 2 The largest exchange segment alone held 137 companies, 14.9% of the number, and 92.2% of the value.1, 2
of listed companies in Sweden were on trading platforms in June 2026, which together held 1.8% of the market value.
SOURCE: STATISTICS SWEDEN, STATISTICAL DATABASE, OUR OWN SUMSo size is measured in two dimensions at once. Against the economy, the Swedish stock market value equalled 199.2% of gross domestic product, measured against the four quarters up to and including the second quarter of 2026.2, 6 That is our own division. The World Bank counts in a different way, with the value at the end of the year and without investment funds and pure holding companies, and gives 148.5% for the world as a whole in 2025, when 53,087 domestic companies were listed in the world.15, 26, 27 The World Bank publishes no figure for Sweden.
The spread between exchanges and participants
The spread between individual exchanges is large. Of the 85 exchanges that reported their number of listed companies to the World Federation of Exchanges for 2025, the smallest had 9 companies and the largest 5,960.14, 25 The median was 162.14, 25 Thirty-three exchanges had fewer than 100 listed companies, and sixteen had at least 1,000.14, 25 Another measure is how much is actually traded: in the Nordic and Baltic exchange group, domestic shares were traded for an amount equal to 35.3% of the market value during 2025.14, 25
A third measure is how many actually trade. In the Nordic and Baltic exchange group there were 93 trading participants on the equity market in 2025, 61 on the bond market and 63 on the derivatives market.14, 25 It is normal for the number of participants to be small compared with the number of listed companies: trading goes through a few members who in turn pass on orders from everyone else.
The debt side, and who actually borrows
Outstanding debt securities issued by Swedish issuers amounted to 9,510,816 million kronor in June 2026, or 140.2% of gross domestic product.5, 6 Anyone who guesses that the state is the largest borrower guesses wrong.
Monetary financial institutions other than the Riksbank accounted for 5,790,189 million kronor, or 60.9% of everything outstanding.5 The group includes banks and other credit institutions. Of that, 2,676,208 million were covered bonds, bonds backed by mortgages.5 The Swedish state accounted for 1,190,373 million, or 12.5%.5 Non-financial companies accounted for 16.2% and municipalities and regions for 3.2%.5
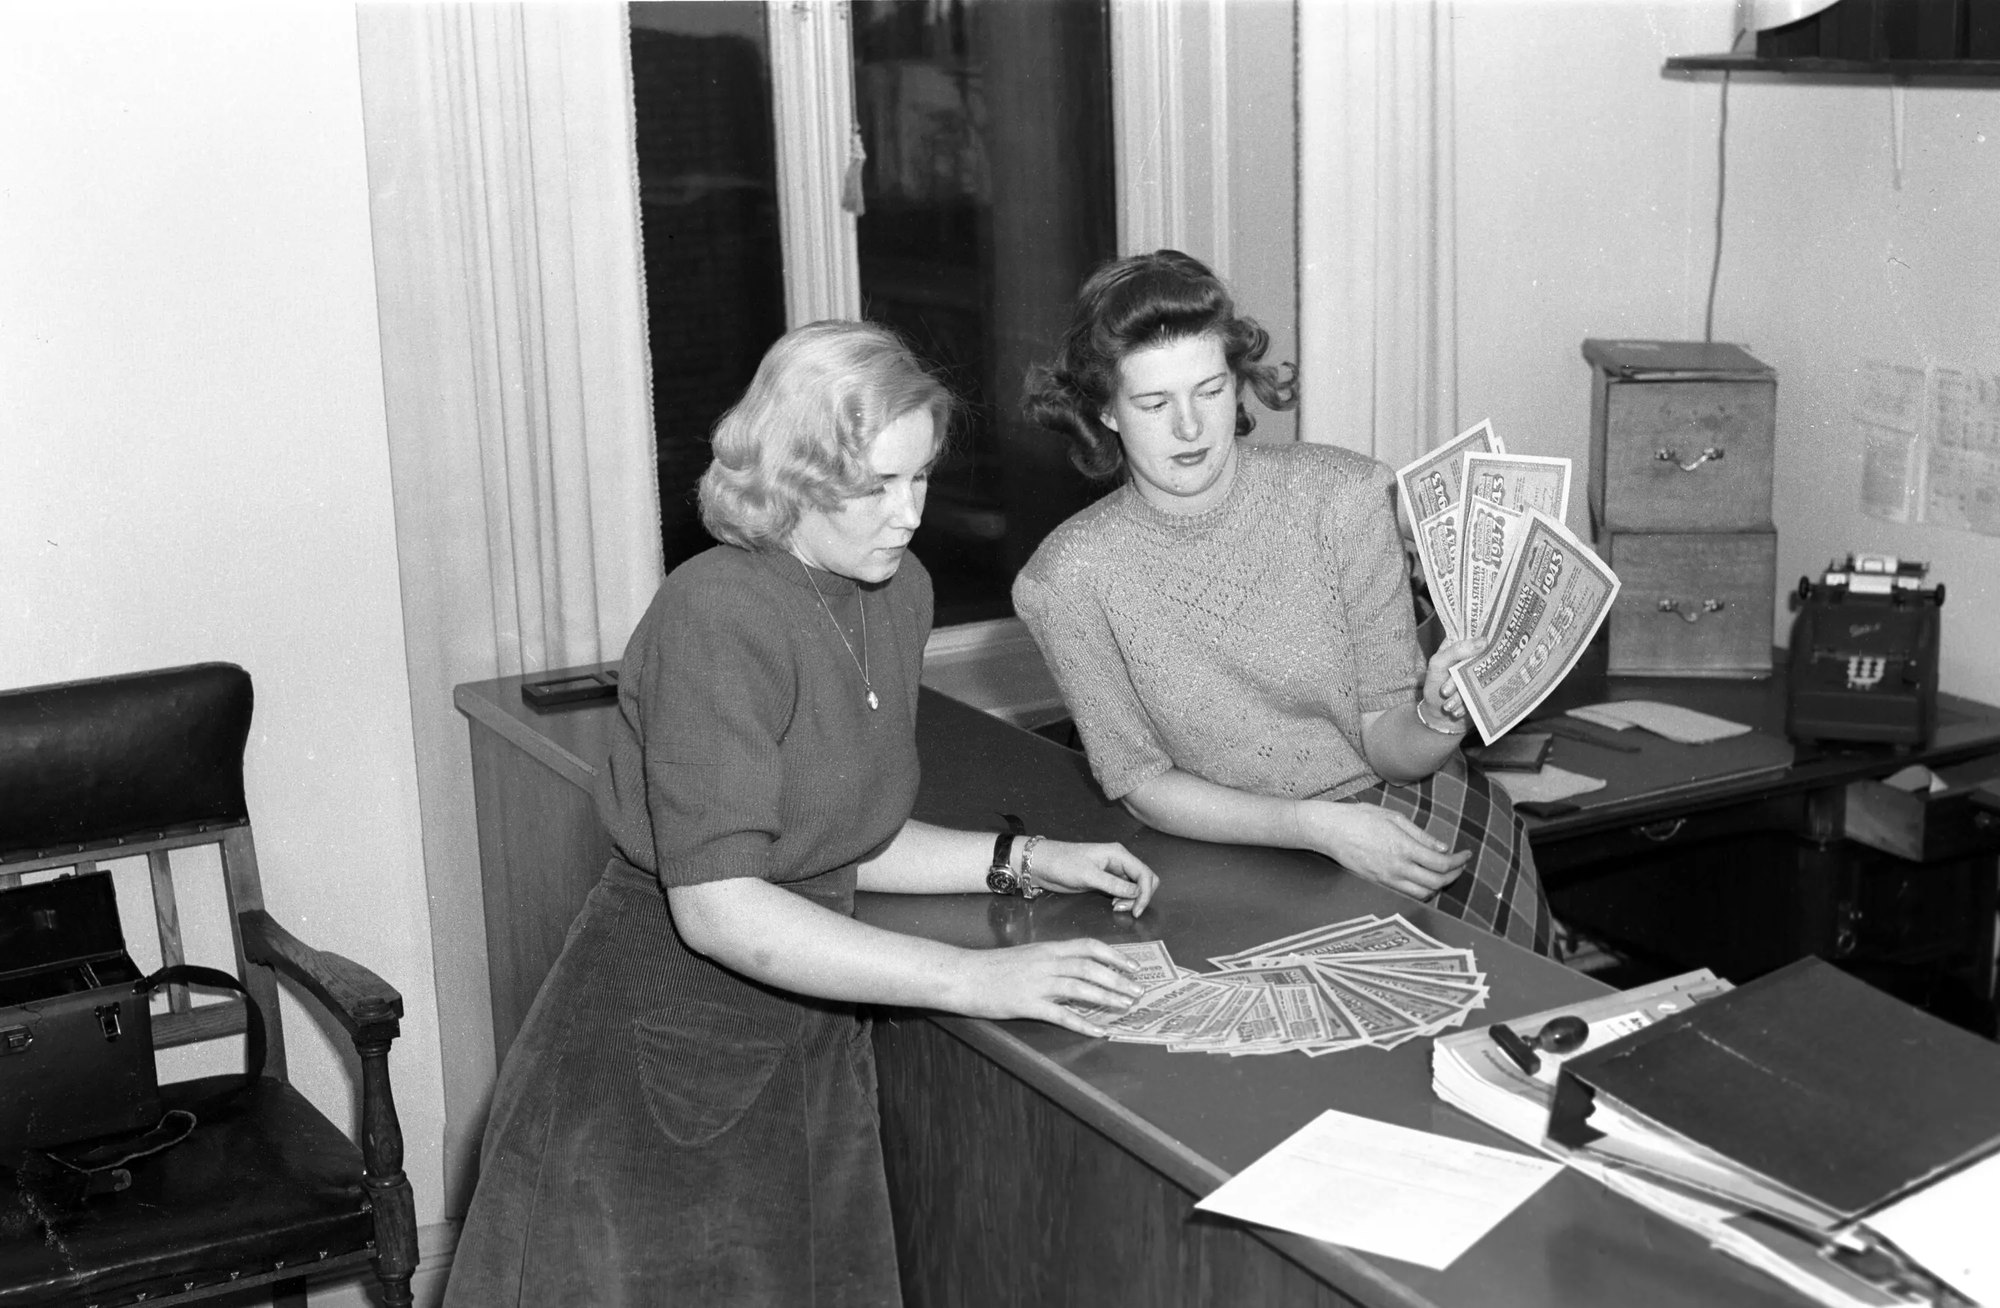
The Riksbank describes the covered bonds as roughly as large as all outstanding government bonds and corporate bonds together, and as equal to almost 40% of Sweden's gross domestic product.12 The national debt itself was 1,249,558,872,203 kronor on 31 August 2026, and the Debt Office has agreements with five dealers who have committed both to bid at every auction and to quote buying and selling prices on the secondary market.10, 11, 21
The debt figures can be checked against an independent source. The Bank for International Settlements reports outstanding debt securities issued by Swedish issuers at 8,724 billion kronor in nominal value at the end of 2025.16, 28 Compared with Statistics Sweden's figure for the same date, excluding the Riksbank's own issues, the two measurements differ by 0.09%.5, 28
Who decides that a market is emerging
The terms developed market and emerging market sound official, but they are set by private index providers according to their own criteria. The two providers this article follows both publish their rules openly, and the criteria differ.17, 18
Two providers, two lists of criteria
For a developed market, one of them requires gross national income per inhabitant to be 25% above the World Bank's high income threshold for three years in a row.17 With the threshold of 13,935 dollars for 2024, the bar becomes 17,418.75 dollars.17 On top of that come size requirements and an assessment of accessibility in five criteria and eighteen sub-measures.17, 29 Sweden has the top rating on all eighteen in the review with data as of 31 May 2026.29 In June 2026 the provider assessed 80 markets and placed 23 as developed, 25 as emerging, 21 as frontier markets and 12 as standalone.29 The total comes to 81 because China is assessed as two markets in the review.
The other uses a matrix of 22 ticked criteria.18 A developed market must meet all 22, an advanced emerging market 16, a secondary emerging market 9 and a frontier market 5.18 The size thresholds are built so that the exit threshold is exactly half the entry threshold.18 In April 2026 it classed 25 markets as developed, 10 as advanced emerging, 13 as secondary emerging and 30 as frontier markets.18
What the label does and does not decide
The fact that the criteria differ has consequences. South Korea and Poland count as developed markets for one provider and as emerging for the other.18, 29 The second provider's system is also younger than it sounds. It grew out of an index that in 1987 covered 23 countries with no split at all.18 The split into developed and emerging was made in 2000, the formal scheme was brought into use in 2004 and frontier markets were introduced in 2008.18
Regulation is a different thing from classification. The International Organization of Securities Commissions, formed in 1983, has more than 200 members that together regulate more than 99% of the world's securities and derivatives markets in more than 130 jurisdictions.19 Its largest committee is the one for growth and emerging markets.19
Sweden did not meet today's openness requirement until 1993
One of the criteria for a developed market is that foreign investors may own freely.17 That did not apply to Sweden until fairly recently.
Until the turn of the year 1992, Swedish limited companies could have so-called foreigner clauses in their articles of association, which divided the shares into restricted and free shares.13, 23 Foreign buyers were normally allowed to acquire less than 40% of the share capital and less than 20% of the votes.23, 24 The Companies Committee (Aktiebolagskommittén) found such clauses in just over 220,000 Swedish limited companies, about 80% of all of them.13, 23 In the autumn of 1991 they were in 188 of 212 listed companies.23 In the 173 companies that had both types of share, the free shares made up on average 21% of the shares, and the same company's share could have two different prices.23
The rules were repealed on 1 January 1993, and existing clauses lapsed automatically when the change took effect.13 The change was mainly a result of Sweden's commitments under the Agreement on the European Economic Area.13
Who owns
The pattern of ownership can be read directly from the statistics. In June 2026, foreign owners held 37.7% of the capital in Swedish listed companies but only 32.7% of the votes.3 The difference arises because Swedish companies often have share classes with different voting power.3 In December 1999, almost seven years after the restricted shares were abolished, the figures were 39.0% of the capital and 17.7% of the votes.3, 13
Households held 11.7% of the capital and 11.2% of the votes.3 Investment funds held 13.2% of the capital, and investment companies 8.8% of the capital but 10.5% of the votes.3
The number of Swedes who own shares directly has fallen over twenty years.4 In December 2006, 19.5% of the population directly owned shares in companies listed on a Swedish marketplace.4 In December 2016 the share was 13.5%, and in June 2026 it was 9.1%, split between 6.1% of women and 12.1% of men.4 Owning through a fund is not counted in that figure.
What the figures do not say
The number of listed companies does not only go up. It rose from 456 in December 2006 to 1,047 in June 2022 and has fallen every half year since then, to 967 in December 2024, 935 in December 2025 and 922 in June 2026.1 Against the population, that is 87.1 listed companies per million inhabitants, a figure that mixes dates because the population refers to 31 December 2024.1, 20
The infrastructure is changing too, on dates that are already set. Within the EU, the time between trade and settlement will be shortened from two days to one, starting on 11 October 2027.8, 31 It is the kind of change no investor notices and that the whole market has to rebuild for.
And the words developed and emerging describe how the market is built, not the country's economy and nothing about what is wise to do. They are set by private providers according to criteria they decide and change themselves.17, 18 Sweden was in the developed group from the moment the split was introduced, but did not meet today's openness criterion until 1993.13, 18, 23
All episodes in this area are at Season 5, Emerging Global Wealth.
What to take away
In June 2026, 922 companies were listed on Swedish marketplaces, 378 on a regulated market and 544 on a trading platform, and 98.2% of the market value was in the regulated part.1, 2 Outstanding debt securities from Swedish issuers amounted to 9,510,816 million kronor, or 140.2% of gross domestic product, where banks and other credit institutions accounted for 60.9% and the state for 12.5%.5, 6 The structure changes slowly and in layers: the share of Swedes who directly owned shares went from 19.5% in December 2006 to 9.1% in June 2026.4 Follow the number of listed companies and the split of ownership in Statistics Sweden's shareholder statistics,1, 3, 4 the outstanding debt amount by group of issuers5 and the exchange statistics from the World Federation of Exchanges.14, 25
Education, not advice.
The fund
Behind the library stands a fund.
Own The Future is published by AIX. The library is the knowledge; AIX Dynamic is the tool, a systematic securities fund (UCITS) that follows the trend and steps aside when risk rises.
This is marketing. Fund units can both rise and fall in value. Read the key information document (KID) and the prospectus before you invest; you will find them on the fund's page at Avanza.
34 UNITHOLDERS · AS OF 15 SEP 2026The future in your inbox.
The most important things from each area, without the noise and without the hype.
Sources
- Statistics Sweden (SCB), Aktieägarstatistik (Shareholder statistics), Statistikdatabasen (the Statistical Database), the table Antal noterade bolag efter svenska marknadsplatser (NoteradeAntalBolag) (Number of listed companies by Swedish marketplace), updated 27 Aug 2026. Selection: all marketplaces, the periods 2006M12 to 2026M06. The number of 922 companies in June 2026, the split by segment and the time series from December 2006. The table path in the open data is FM/FM0201/FM0201D/NoteradeAntalBolag.
- Statistics Sweden, Aktieägarstatistik, Statistikdatabasen, the table Aktieägande efter sektor och marknadsplats (AktieAgarMarknadN) (Shareholding by sector and marketplace), updated 27 Aug 2026. Selection: all sectors and marketplaces, market value in million kronor, the period 2026M06. The market value of 13,515,619 million kronor and its split by segment. The table path in the open data is FM/FM0201/FM0201A/AktieAgarMarknadN.
- Statistics Sweden, Aktieägarstatistik, Statistikdatabasen, the table Aktieägande efter sektor och aktieserie (AktieAgarSerieN) (Shareholding by sector and share class), updated 27 Aug 2026. Selection: all owner sectors, share of capital and of votes, the periods 1999M12 and 2026M06. The ownership shares for foreign owners, households, investment funds and investment companies. The table path in the open data is FM/FM0201/FM0201A/AktieAgarSerieN.
- Statistics Sweden, Aktieägarstatistik, Statistikdatabasen, the table Andel aktieägare av totalbefolkningen efter kön och ålder (HushallAktieAgaAndel) (Shareholders as a share of the total population by sex and age), updated 27 Aug 2026. Selection: all ages, both sexes together and women and men separately, the periods 2006M12, 2016M12 and 2026M06. The share of the population that directly owns listed shares: 19.5% in December 2006, 13.5% in December 2016 and 9.1% in June 2026, the last split between 6.1% of women and 12.1% of men. The table path in the open data is FM/FM0201/FM0201B/HushallAktieAgaAndel.
- Statistics Sweden, Emitterade värdepapper (Issued securities), Statistikdatabasen, the table Utestående och emitterat belopp under månaden samt räntekostnader (FM9998T03N) (Outstanding and issued amounts during the month and interest costs), updated 18 Aug 2026. Selection: all seven sectors, the item debt securities in total, all currencies, table content outstanding nominal amount issued at the end of the month in million kronor, the month 2026M06. The sum of the sectors is 9,510,816 million kronor. The table path in the open data is FM/FM9998/FM9998A/FM9998T03N.
- Statistics Sweden, Nationalräkenskaperna (National accounts), Statistikdatabasen, the table BNP från användningssidan, försörjningsbalans efter användning (NR0103ENS2010T01Kv) (GDP by expenditure). Selection: GDP at market prices, current prices in million kronor, the quarters 2025Q3 to 2026Q2. The sum of 6,784,842 million kronor is the denominator in the ratios to GDP. The table path in the open data is NR/NR0103/NR0103A/NR0103ENS2010T01Kv.
- Swedish Financial Supervisory Authority (Finansinspektionen), företagsregistret (the company register). The number of exchanges, regulated markets, trading platforms, central securities depositories, central counterparties, clearing organisations and investment firms authorised in Sweden.
- Swedish Financial Supervisory Authority, Kortare avvecklingscykel (T+1) (Shorter settlement cycle). The switch within the EU on 11 Oct 2027.
- Swedish National Debt Office (Riksgälden), Historia (History). The debt write-off in 1815, the pledging of Pomerania, the founding of the agency in 1789 and the section Start för penningmarknaden (Start of the money market) on bond borrowing abroad from 1840.
- Swedish National Debt Office, Statsskulden (The national debt). The size of the national debt on 31 Aug 2026.
- Swedish National Debt Office, Återförsäljare (Dealers), updated 21 Jan 2026. The five dealers in Swedish government securities and which instruments each has committed to.
- Sveriges Riksbank (Riksbanken), Finansiell stabilitetsrapport 2026:1 (Financial stability report 2026:1), published 29 May 2026, the article on covered bonds. The size of the outstanding volume compared with other kinds of bond and with GDP.
- The Swedish Parliament (Sveriges riksdag), proposition 1992/93:68 om ändring i aktiebolagslagen (government bill 1992/93:68 amending the Companies Act). The repeal on 1 Jan 1993, that existing clauses lapsed automatically, and the link to the EEA Agreement.
- World Federation of Exchanges, 2025 Annual Statistics Guide, published 18 Aug 2026. The number of reporting exchanges, the spread in the number of listed companies, the median and the turnover velocity in the Nordic and Baltic group.
- World Bank (Världsbanken), World Development Indicators, the indicators for market capitalisation as a share of GDP and the number of domestic listed companies, the World aggregate for 2025.
- Bank for International Settlements (BIS, Banken för internationell betalningsutjämning), Debt securities statistics, outstanding debt securities by country of issuer. The check figure for Swedish issuers at the end of 2025.
- MSCI, Market Classification Framework and Global Market Accessibility Review, June 2026. The income threshold, the size requirements, the five accessibility criteria with eighteen sub-measures and the number of markets per category.
- FTSE Russell, Equity Country Classification Process, version 3.4, July 2026. The matrix of 22 criteria, the requirements per category, the size thresholds, the classification in April 2026 and the history of the system from 1987.
- International Organization of Securities Commissions, About IOSCO. Number of members, coverage and the committee structure.
- Statistics Sweden, Statistikdatabasen, Folkmängden efter region, civilstånd, ålder och kön, år 1968 till 2024 (Population by region, marital status, age and sex, 1968 to 2024). The population of the country, 10,587,710 people on 31 December 2024, which is the denominator in the figure of 87.1 listed companies per million inhabitants.
- Swedish National Debt Office, Sveriges statsskuld 31 augusti 2026 (Sweden's national debt, 31 August 2026), monthly report (PDF, 10 pages). The official measure of the state's gross debt, 1,249,558,872,203 kronor.
- Sveriges Riksbank, Ensamrätt att ge ut sedlar (Sole right to issue banknotes), historical timeline. That the decision was made in 1897, that it took effect at the start of 1904 and that only then could the bank conduct monetary policy in the modern sense.
- The Companies Committee (Aktiebolagskommittén), Bundna aktier (Restricted shares), SOU 1992:13, interim report, digitised by the National Library of Sweden (Kungliga biblioteket) (PDF, 115 pages). Just over 220,000 limited companies and about 80%, 188 of 212 listed companies in the autumn of 1991 and the 173 companies with 21% free shares.
- The Swedish Parliament, Lag (1982:617) om utländska förvärv av svenska företag m.m. (Act on foreign acquisitions of Swedish companies), section 4. The limits of less than forty per cent of the share capital and less than twenty per cent of the votes; the act was repealed on 1 Jan 1992, while the clauses in articles of association lived on until 1 Jan 1993.
- World Federation of Exchanges, 2025 Annual Statistics Guide, spreadsheet published 18 Aug 2026 (xlsx, 5.2 MB). The sheet Equity 3 with 85 reporting exchanges, smallest 9 and largest 5,960, median 162, 33 under 100 and 16 with at least 1,000, the sheet Equity 9 with the turnover velocity 0.353393 and the sheet Equity 8 with 93, 61 and 63 trading participants.
- World Bank, World Development Indicators, börsvärde för noterade inhemska bolag i procent av BNP, aggregatet World 2025 (market capitalisation of listed domestic companies as a percentage of GDP, World aggregate 2025), extract from the publisher's open API. The figure 148.539439352084% and that the indicator refers to end-of-year values and excludes investment funds, unit trusts and pure holding companies.
- World Bank, World Development Indicators, antal noterade inhemska bolag, aggregatet World 2025 (number of listed domestic companies, World aggregate 2025), extract from the publisher's open API. The figure of 53,087 companies.
- Bank for International Settlements, Debt securities statistics, serien Sweden, debt sec, issued by residents, all markets, all original maturities, all currencies, nominal value, stocks (the series for Sweden), extract from the publisher's statistics service. The figure of 8,724.262762101 billion kronor for the fourth quarter of 2025.
- MSCI, 2026 Global Market Accessibility Review, June 2026 (PDF, 78 pages). The 80 markets assessed and the footnote about 81, the 18 measures, table 1 with 23, 25, 21 and 12 markets, Sweden's top rating on all 18 and that the data refer to conditions on 31 May 2026.
- Swedish Financial Supervisory Authority, företagsregistret, sökning per institutkategori (the company register, search by category of institution), read on 14 Sep 2026: börs, reglerad marknad, handelsplattform, värdepapperscentral, central motpart, clearingorganisation and värdepappersbolag (exchange, regulated market, trading platform, central securities depository, central counterparty, clearing organisation and investment firm). 2 exchanges, 2 regulated markets, 3 trading platforms, 1 central securities depository, 1 central counterparty, 2 clearing organisations and 122 investment firms; the register is live and the figures apply on the day it was read.
- European Union, Europaparlamentets och rådets förordning (EU) 2025/2075 av den 8 oktober 2025 om ändring av förordning (EU) nr 909/2014 vad gäller en kortare avvecklingscykel i unionen (Regulation (EU) 2025/2075 on a shorter settlement cycle in the Union, Swedish language version). That the intended settlement date must be no later than the first business day after the trading day, that the requirement before the change was the second business day and that the regulation applies from 11 Oct 2027.
- European Union, Europaparlamentets och rådets förordning (EU) nr 909/2014 (Regulation (EU) No 909/2014 on central securities depositories, Swedish language version), Article 2(1) and section A of the annex. What a central securities depository is, and that central maintenance of securities accounts at the top tier is one of its core services.
- European Union, Europaparlamentets och rådets förordning (EU) nr 648/2012 (Regulation (EU) No 648/2012 on OTC derivatives, central counterparties and trade repositories, Swedish language version), Article 2(1). That a central counterparty steps in between the counterparties and becomes the buyer to every seller and the seller to every buyer.
- Gävleborg County Museum (Länsmuseet Gävleborg), Köp av obligationer. 1947. (Buying bonds. 1947.), collection record XLM.CL009066 on DigitaltMuseum. The subject, the year 1947, the place Gävle, the photographer and the Public Domain Mark licence.
Links retrieved 9 Sep 2026.
Extended on 14 Sep 2026 with the tables, reports and legal acts that carry the figures behind the seven landing pages that were in the list: the Debt Office's monthly report for August, the spreadsheet behind the exchange statistics, the two extracts from the World Bank's indicator database, the series from the Bank for International Settlements, the accessibility review from June 2026, the seven searches in the Swedish Financial Supervisory Authority's company register and the report Bundna aktier (Restricted shares). Also added are the population, the central bank's own timeline, the settlement regulation, the two EU regulations that define a central securities depository and a central counterparty, and the museum record for the photograph. The measures of 199.2% and 140.2% of gross domestic product are our own division of Statistics Sweden's figures, and the World Bank's world figure is calculated on a different basis.