OWN THE FUTURE · SEASON 4 · CLIMATE & RESOURCE SCARCITY
How much water does Sweden have, and where does it run out?
Water is a resource that is measured, shared out and sometimes runs out locally. We explain how water supply works, what it costs and where the shortages are today.
Published 10 Sep 2026 · About 13 minutes to read
In a photograph from 1892, the Skanstull waterworks in Stockholm stands like a brick church with a chimney.15 In front of the building are two open basins. Two men in dark coats stand in the yard and give the building scale. The treatment took place outdoors, and you could watch it.
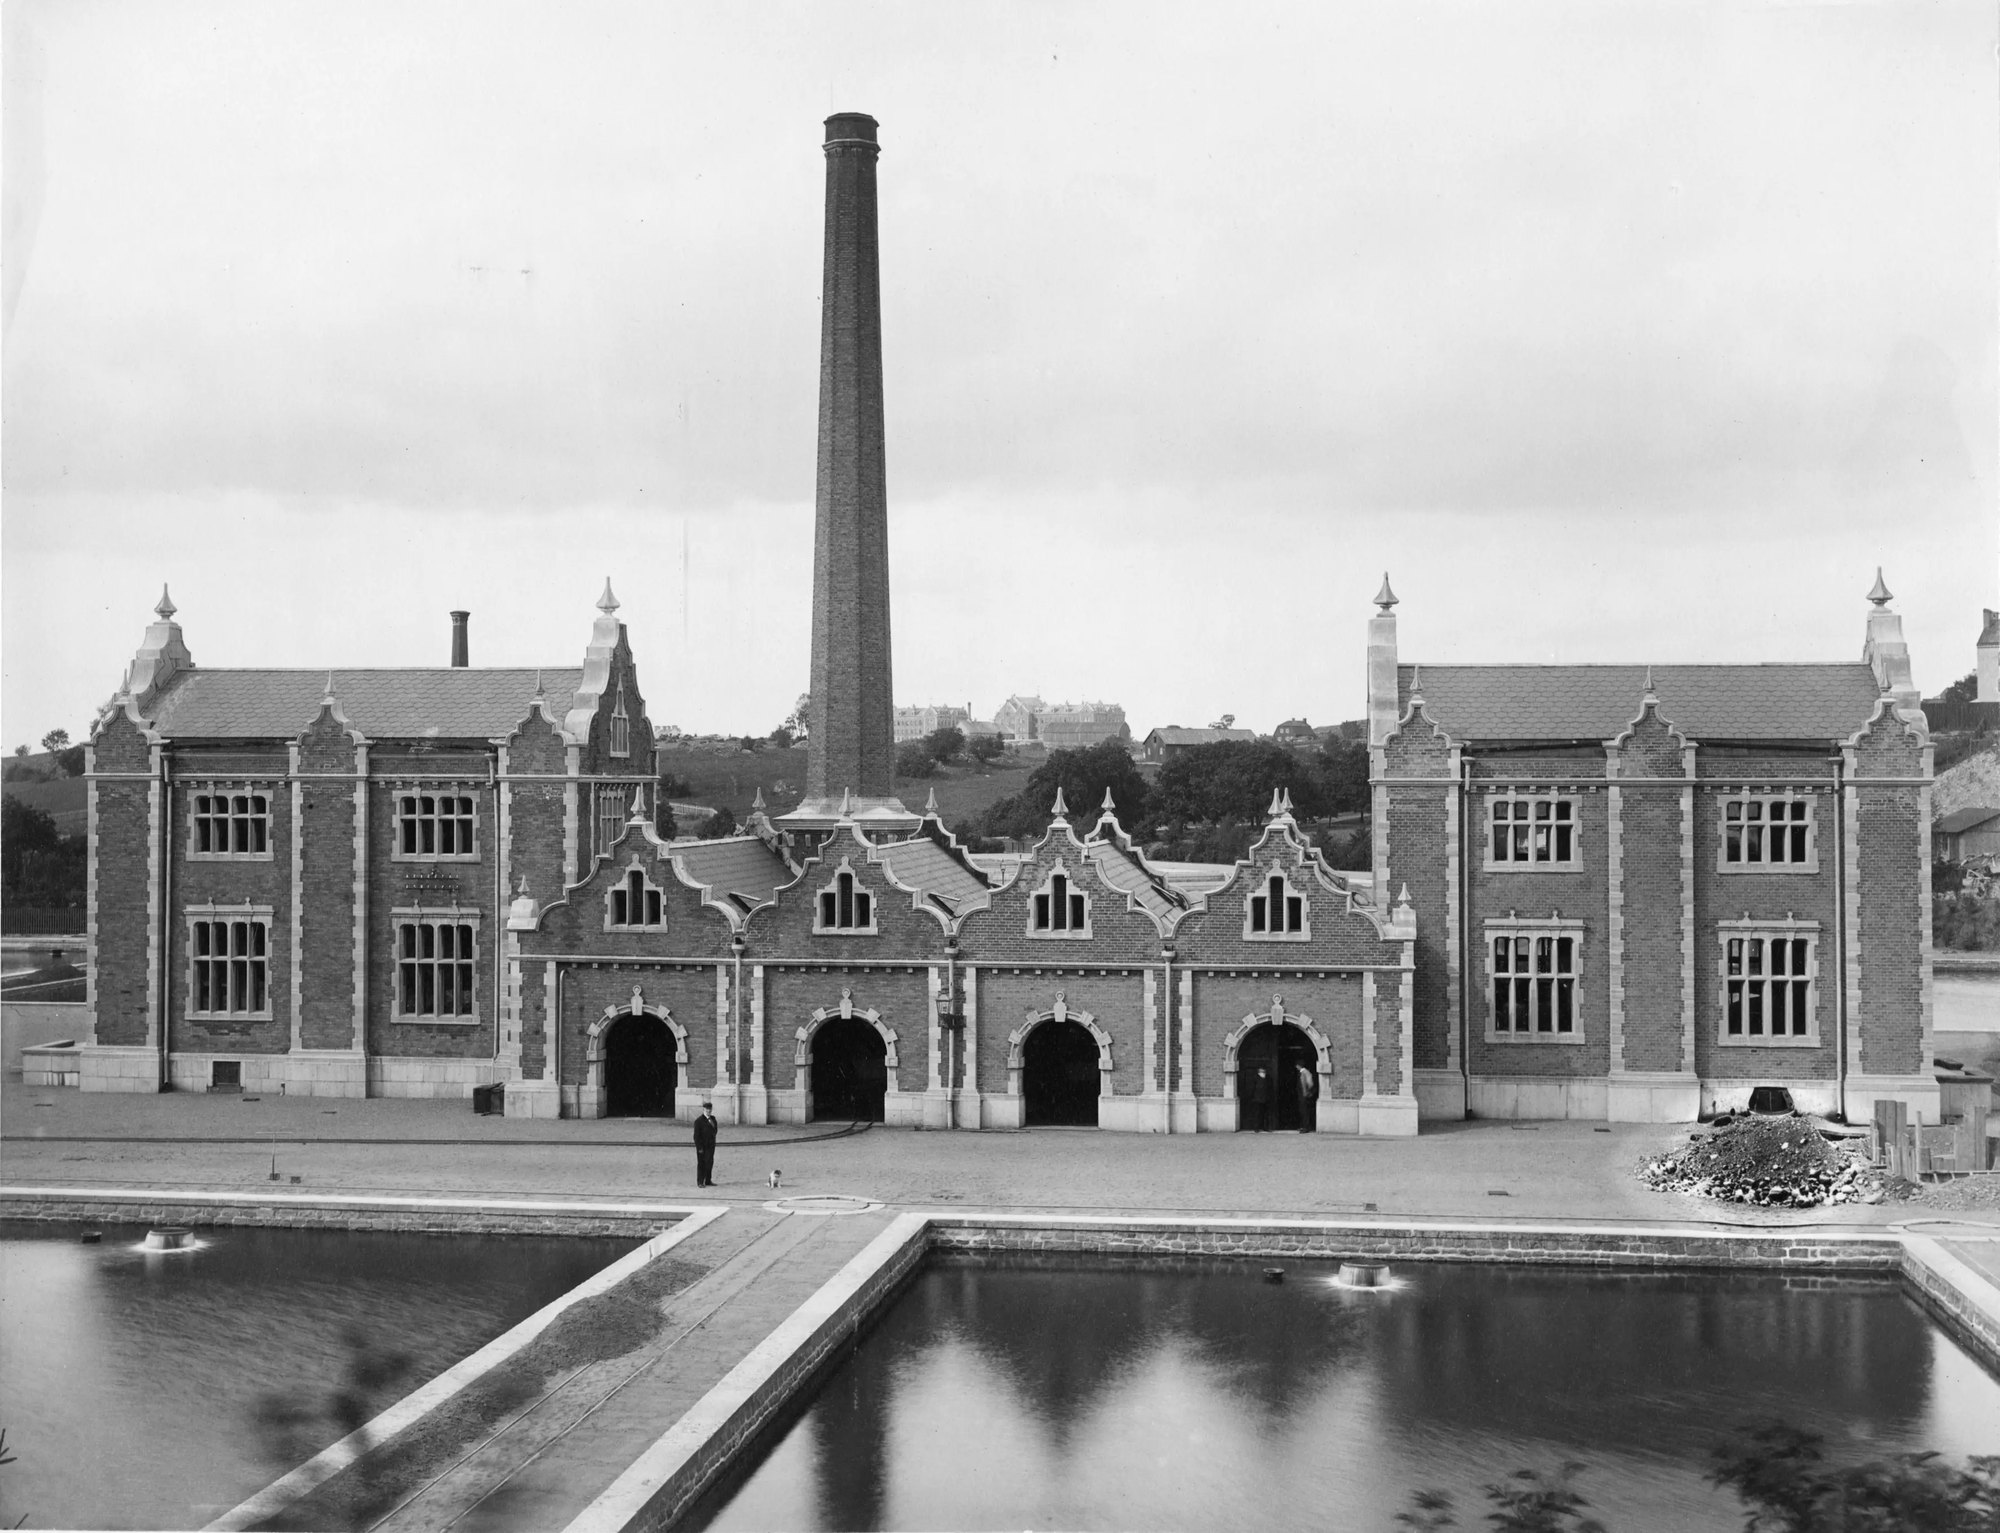
Today the same steps take place indoors, underground or inside a filter. This article counts up the system again: where the water comes from, how far it travels, what it costs and where it runs out. The networks above ground were counted in S3:E1 Infrastructure. Here the networks lie underground, and the municipalities manage them.
The chain has five links and is paid for with a charge
The water that is to become drinking water is called raw water and is taken from a lake, a river or an aquifer.7, 8 A waterworks treats it. A pipe network distributes it. A sewer network carries away the wastewater and the stormwater, in two partly separate systems. A treatment plant cleans the water and releases it back.
The cold water from the tap is a food in the legal sense and is checked accordingly.16 The hot water in a private household is not.16
The most important difference from roads and railways lies in the financing. Water and sewerage are paid for with a charge regulated by the Public Water Services Act, and Section 30 sets the ceiling: the charges may not exceed what is needed to cover the costs necessary to set up and run the system.11 So the service may not make a profit.11 Anyone who pays more in one municipality than in another is paying for a more expensive system, nothing else.
Where the water comes from, and why the agencies say different things
Municipal water withdrawals in 2020 were 873,801 thousand cubic metres.1 Of this, 59.4% came from surface water, 22.5% from groundwater, 17.9% from artificial groundwater and 0.15% from desalinated seawater.1
Artificial groundwater explains a confusion you can come across in every brochure. Surface water is allowed to seep through a gravel ridge, forms groundwater and is pumped up from wells. Statistics Sweden (SCB) counts it as surface water, in line with the EU definition.1, 2 Counted that way, 77.3% of municipal water came from surface water in 2020.1 If you instead count the infiltration as groundwater, the groundwater share becomes 40.4%.1 The Swedish Food Agency's (Livsmedelsverket) wording of half and half and the Swedish Agency for Marine and Water Management's (Havs- och vattenmyndigheten) wording of more than half from surface water are both correct, but they rest on different ways of treating the same 156 million cubic metres.1, 2, 7, 9 Every sentence about the split therefore needs to say which definition it uses.
Desalinated seawater entered the statistics in 2020 and accounts for 0.15%.1, 2 The plants are on Öland and Gotland.2 The figure is small, and it says something about where the need arose first.
Five times round the Earth
The industry body Svenskt Vatten (Swedish Water) measures three networks in its operations survey for 2024. The drinking water network was 83,870 kilometres, the wastewater network 76,427 kilometres and the stormwater network 40,492 kilometres, not counting service pipes.13 Together 200,789 kilometres.13 The Earth's circumference at the equator is 40,075 kilometres, so the network goes round five times and the drinking water part alone twice.13, 17
On top of that come 1,839,910 water service connections, 1,792,855 water meters at subscribers, 2,571 booster stations and 16,116 pumping stations on the wastewater side.13
The number of plants is harder to pin down than the length. The same operations survey gives 1,527 municipal waterworks and 1,666 municipal wastewater treatment plants for 2024.13 Other Swedish sources give other figures for almost the same thing: about 2,000 municipal waterworks plus nearly 3,000 private ones according to the Swedish Food Agency, and 433 wastewater treatment plants according to Statistics Sweden, which only counts those above 2,000 population equivalents.7, 18 The figures measure different things, and anyone quoting one of them needs to spell out the boundary in the same sentence.
The unevenness is greater than the numbers suggest. Under the environmental objective Good-Quality Groundwater, a total of 1,686 municipal groundwater sources and 183 municipal surface water sources were reported for 2025.10 The surface water sources are just under a tenth of the number and supply about half the country's drinking water.7, 10
The network is younger than most people think
Statistics Sweden's time series on connection to municipal water starts in 1960. Then 3,704,000 people had municipal water in the house, that is 49.4% of the population.1 Twenty years later the share was 85.1%.1 In 2024, 9,412,182 people were connected, 88.9%, and 1,175,528 people were outside the system.1
Tap water for almost everyone is therefore something built within living memory. Most of the Swedish network was laid over two decades and is now 45 to 65 years old.1 That explains why renewal is costing money right now, and it also explains why the charge differs between municipalities: those who built early have had time to write off the system, those rebuilding now carry the capital cost.
Eight point four öre
The charge statistics for 2026 are based on a model house, a normal detached house that uses 150 cubic metres a year.12 The average for the country's 290 municipalities was 12,547 kronor a year and the median 12,374 kronor.12 Fagersta Municipality had the lowest charge at 5,372 kronor and Trosa Municipality the highest at 25,695 kronor.12 The difference is 20,324 kronor a year for the same defined house with the same use, that is 4.8 times.12
Counted per litre, the average comes to 8.4 öre, an öre being a hundredth of a krona, with 3.6 öre in the cheapest municipality and 17.1 öre in the most expensive.12 Those öre pay for three services at once: drinking water into the house, wastewater out and stormwater away.
Connecting a new single-family house cost an average of 204,954 kronor in 2026, with a median of 184,779 kronor.12 The whole system cost 29.9 billion kronor to run in 2024, and at the same time 34.8 billion kronor was invested, together about 6,100 kronor per inhabitant.3, 13
One litre in six is counted as lost
The municipal waterworks delivered 842,189,428 cubic metres of drinking water in 2024.13 Of this, 17.1% disappeared before it passed a subscriber's water meter, against 19.4% the year before.13 In volume that is 144 million cubic metres a year, or 41.8 litres per connected person per day.13
The industry body Svenskt Vatten itself warns against reading the percentage as a measure of quality. It gives the financial loss and the loss of the resource, but says nothing about the condition of the distribution network.13 The measure of condition is litres per metre of pipe per day, and it was 4.7 litres in 2024 against 5.3 the year before.13 A municipality with a long network per inhabitant gets a high percentage even with small leaks per kilometre, which makes the percentage unfair on sparsely populated areas.13
The figure also contains more than leaks. Unauthorised use and meter errors fall under the same item, and a broader measure of delivered volume that brings in no revenue was 22.0% in 2024.13
Households are not the big user
Showers and lawns dominate the conversation about water. The statistics point in another direction. Of Sweden's freshwater withdrawals in 2020, 61.3% went to industry, 22.5% to households, 12.1% to other uses and 4.0% to agriculture.1, 2 So industry uses almost three times as much freshwater as all households together.1, 2 Of industry's freshwater use in 2020, about 47% went to cooling.1 If you include seawater, cooling water's share of industry's total water use was about 60%.1
Outside those figures is the cooling water of the nuclear power stations, nearly 8.7 billion cubic metres of seawater in 2020, which Statistics Sweden leaves out of the compilation because it would otherwise dominate the whole statistics.2 The figures above refer to freshwater.
According to Statistics Sweden's calculation, a household used 155 litres per person per day in 2020.2 The operations survey gives 121 litres for 2024, and the difference between the two figures comes from different methods and different years.13 Whichever figure is used, the source and the year need to be in the same sentence.
The leakage can be set against agriculture. Sweden lost 144 million cubic metres of drinking water in the networks in 2024.13 Agriculture used 102 million cubic metres of water in 2020.1, 2 The figures refer to different years, but the order of magnitude holds.
Fourteen of twenty-one counties
Sweden's water withdrawals were equal to about 1.3% of the renewable freshwater resources in 2020.2 Statistics Sweden puts the resources at just under 200 billion cubic metres.2 Internationally, a country only counts as water-stressed at 20% and as suffering acute water scarcity at 40.2 Sweden is among the lowest in Europe.2
Even so, on 9 Sep 2026 a notice of risk of water shortage because of low groundwater levels was in force in 14 of the country's 21 counties.4, 5 Just under 8.9 million people lived in them, that is 83.5% of the population.3, 4 If you include Gävleborg County, which on the same day had a notice that only covered watercourses, it becomes 15 counties and 86.2%.3, 5
The two figures do not clash. Water is measured nationally and used locally, and a national balance sheet says nothing about whether there is water in the right place at the right time.
Why the shortage is local and seasonal
Geography accounts for one half of the explanation. The water balance calculation of the Swedish Meteorological and Hydrological Institute (SMHI) for the normal period 1991 to 2020 gives an average annual runoff of over 1,000 millimetres a year in the mountains and down towards 100 millimetres in parts of eastern Götaland and Svealand.6 In the driest areas more than 70% of precipitation evaporates, in parts of the mountains less than 20%.6 The water is where people do not live.
The season accounts for the other. The Swedish Agency for Marine and Water Management describes how the stores are refilled: lakes, watercourses and aquifers are filled mainly during the winter half of the year and when the snow melts, while summer rain is largely taken up by vegetation and evaporates.9 So a dry winter half-year is only noticed in July. On 9 Sep 2026 the Geological Survey of Sweden (Sveriges geologiska undersökning, SGU) described the situation by saying that groundwater had not been refilled enough during the year, that a deficit remained from the year before in Götaland and eastern Svealand, and that the summer had been dry in the south.4
The size of the aquifer decides how quickly it shows. Small aquifers in till and bedrock respond to rain within a few days and can vary by several metres in a year.4 Large aquifers in eskers respond over months.4 A dry spell therefore knocks out private wells long before municipal water sources.
What a notice of water shortage means
A word about the level. SGU and SMHI have issued notices of this kind since 2017, and a notice is issued as soon as particularly sensitive groups risk having problems.4 SMHI's warnings require consequences for society at large and so sit at a higher level.4 The figure 14 of 21 refers to notices.
The longest-running notice covered Skåne County and on 9 Sep 2026 had been in force since 21 April, that is for 141 days.5 In August the same year, the Skåne County Administrative Board (Länsstyrelsen Skåne) wrote that water levels in Lake Vombsjön in February 2026 were the lowest measured for the time of year since measurements began in 1969, and that some streams and parts of rivers had dried up and several wells had run dry.14
Hosepipe bans are decided by the municipality
There is no national list of hosepipe bans and no agency that counts them.14 The decision lies with the municipality or with the water utility, and the legal basis is Section 23 of the Public Water Services Act, which gives the municipality the right to issue regulations on the use of the system.11 The regulations are set out in the municipality's general terms, which are based on the industry body's model text and state that the utility does not guarantee a particular water pressure or a particular amount of water, and that the property owner must reduce their use as the utility instructs.19 So a hosepipe ban binds everyone on municipal water.
Two consequences come as a surprise. The charge is not lowered during a ban, because the costs of the system do not fall when the ban comes in.11 And there is currently no legislation that clearly sets out how drinking water should be prioritised when a municipality runs short of water.20
In August 2026 hosepipe bans were in force in Hurva in Eslöv Municipality and in Verum in Hässleholm Municipality, according to the county administrative board, which also pointed out that the list was not necessarily complete because the decisions are made municipality by municipality.14
Three to five litres
The Swedish Food Agency's advice on home preparedness puts the need at three to five litres of water per adult per day, for drinking, cooking and basic hygiene together.7
was the average cost of one litre of municipal water in 2026. The price covers drinking water into the house, wastewater out and stormwater away.
SOURCE: CHARGE STATISTICS FOR 290 MUNICIPALITIES, 2026Set against everyday use, a Swedish household uses about thirty times more water per person per day than the need the state plans for in a crisis.2, 7, 13 Behind the preparedness stands VAKA, the national water emergency group, which the Swedish Food Agency leads and which is on standby around the clock all year.21
Drinking water is also the most regulated food in the country.8 The Swedish Food Agency's regulations from 2022 contain 66 parameters in Annex 1: two microbiological, 38 chemical and radioactive, and 26 indicator parameters.8 On 1 Jan 2026 the limits for arsenic, lead, cadmium and chromium were tightened, and two PFAS parameters began to apply for the first time, at 4.0 nanograms per litre for PFAS 4 and 100 nanograms per litre for PFAS 21.8
What the figures do not say
Sweden's official statistics on water withdrawals refer to 2020.1 The survey is done every five years, and on 9 Sep 2026 Statistics Sweden's product page said that no new publication was planned.1 Every figure on withdrawals and use in this article therefore carries the year 2020 and does not describe today.
The details of water sources come from SGU's water source archive, where collection stopped in December 2024.10 The data then came from 260 of 290 municipalities, which makes the figures an almost complete inventory and not a fully complete one.10
The number of waterworks differs between five Swedish sources, and the two figures for households' daily use differ by just over a quarter.7, 10, 13, 18 None of the sources is wrong. They measure different things, and that is exactly what makes water hard to sum up in a single figure.
No single agency owns the issue. The Swedish Food Agency coordinates drinking water and writes the regulations, SGU is responsible for groundwater, SMHI and SGU issue the notices together, the Swedish Agency for Marine and Water Management manages lakes and watercourses, the municipal environmental office carries out the checks, and the municipality is responsible for making sure the water is there.4, 7, 8, 9 Svenskt Vatten is the industry body for the municipal water and sewerage organisations and not a government agency.13
What to take away
Sweden's water withdrawals were about 1.3% of the renewable freshwater resources in 2020, and yet a notice of risk of water shortage was in force in 14 of 21 counties on 9 Sep 2026.2, 4, 5 Water is measured nationally and used locally: the stores are refilled during the winter half of the year, most of the networks were laid over two decades and are now 45 to 65 years old, and the charge may only cover the costs of the system itself.1, 9, 11 Follow three figures. SGU and SMHI issue the notices of risk of water shortage county by county.4, 5 The industry body Svenskt Vatten publishes the leakage measure of litres per metre of pipe per day, 4.7 litres in 2024, and the charge statistics for 290 municipalities, an average of 8.4 öre per litre in 2026.12, 13
The next episode is S4:E4 Food & Agriculture, about how the food chain is built and what it uses up.
Education, not advice.
The fund
Behind the library stands a fund.
Own The Future is published by AIX. The library is the knowledge; AIX Dynamic is the tool, a systematic securities fund (UCITS) that follows the trend and steps aside when risk rises.
This is marketing. Fund units can both rise and fall in value. Read the key information document (KID) and the prospectus before you invest; you will find them on the fund's page at Avanza.
34 UNITHOLDERS · AS OF 15 SEP 2026The future in your inbox.
The most important things from each area, without the noise and without the hype.
Sources
- Statistics Sweden (SCB), Vattenuttag och vattenanvändning i Sverige (Water withdrawal and water use in Sweden), statistical database MI0902. Connection to municipal water 1960 to 2024, municipal water withdrawals by type of water in 2020, and the split of freshwater use between industry, households, other uses and agriculture.
- Statistics Sweden, Vattenanvändningen i Sverige 2020 (Water use in Sweden 2020), report MI 27 BR 2201, published 8 Dec 2022. The renewable water resources of just under 200 billion cubic metres, the share withdrawn, the thresholds of 20 and 40%, households' 155 litres per person per day, and nuclear power's seawater withdrawals.
- Statistics Sweden, Statistikdatabasen, folkmängden per månad (Statistical Database, population by month). The population of the country and of each county in July 2026, the denominator in the calculation of the share of the population. The table is protected with the cell key method, which makes individual counts of people approximate.
- Geological Survey of Sweden (Sveriges geologiska undersökning), Risk för vattenbrist (Risk of water shortage) and Aktuella grundvattennivåer (Current groundwater levels). The list of the 14 counties that had a notice because of low groundwater levels on 9 Sep 2026, the description of the situation on the same day, the difference between large and small aquifers, and that notices have been issued since 2017.
- Swedish Meteorological and Hydrological Institute (SMHI), öppna data om varningar och meddelanden (open data on warnings and notices), extract of 9 Sep 2026. The independent check of the list of counties, the start date of 21 Apr 2026 for Skåne, and the difference between notices about groundwater and about watercourses.
- SMHI, Sveriges hydrologi i ett förändrat klimat (Sweden's hydrology in a changing climate), the Hydrologi series no. 135, published 4 Mar 2026. The average annual runoff from over 1,000 down towards 100 millimetres a year, and evaporation's share of precipitation for the normal period 1991 to 2020.
- Swedish Food Agency (Livsmedelsverket), Dricksvattenproduktion (Drinking water production) and Dricksvatten i dunk (Drinking water in containers). The number of municipal and private waterworks, that only cold water is classed as food, the need for three to five litres per person per day, and VAKA.
- Swedish Food Agency, föreskrifter om dricksvatten, LIVSFS 2022:12 (regulations on drinking water). The 66 parameters in Annex 1, the tightened limits from 1 Jan 2026 and the two PFAS parameters.
- Swedish Agency for Marine and Water Management (Havs- och vattenmyndigheten), Vattenbrist och dricksvattenförsörjning (Water shortage and drinking water supply). That the stores are refilled during the winter half of the year and that summer rain does not refill groundwater in the same way.
- Swedish Environmental Protection Agency (Naturvårdsverket), indikatorn Vattenskyddsområden (the indicator Water protection areas), with SGU as data provider. The 1,686 municipal groundwater sources and 183 surface water sources in 2025, and that the water source archive was closed in December 2024 with data from 260 municipalities.
- The Swedish Parliament (Sveriges riksdag), lagen (2006:412) om allmänna vattentjänster (the Public Water Services Act). The definitions of connection charge and usage charge, the cost-price ceiling in Section 30 and the municipality's right under Section 23 to issue regulations on use, which is the legal basis for hosepipe bans.
- The industry body Svenskt Vatten, 2026 års taxestatistik (Charge statistics 2026) and the attached taxestatistiken per kommun (charge statistics by municipality). The usage charge for model house A in all 290 municipalities, the average of 12,547 kronor, the extremes in Fagersta and Trosa, and the connection charge. Average and ratio worked out by the editors from the municipality file.
- The industry body Svenskt Vatten, Resultatrapport för VASS Drift 2024, rapport R2025-04 (Results report for VASS operations 2024), published December 2025. The pipe lengths, the number of plants, the volume delivered, the water losses of 17.1% and the measure of 4.7 litres per metre of pipe per day.
- Skåne County Administrative Board (Länsstyrelsen Skåne), Vattenläget i Skåne (The water situation in Skåne), page updated 17 Aug 2026. The levels of Lake Vombsjön in February 2026, the dried-up streams and the hosepipe bans in Hurva and Verum.
- Swedish National Museum of Science and Technology (Tekniska museet), samlingsposten TEKA0152211 (collection record TEKA0152211) on DigitaltMuseum. The photograph of the Skanstull waterworks from 1892, licence Public Domain Mark.
- Swedish Food Agency, Dricksvatten (Drinking water), read 13 Sep 2026. Supports that only cold tap water is checked and that hot water in private households does not count as food, and the agency's own figure of about 140 litres per inhabitant per day.
- National Geospatial-Intelligence Agency, Department of Defense World Geodetic System 1984, Its Definition and Relationships with Local Geodetic Systems, standard document NGA.STND.0036_1.0.0_WGS84, version 1.0.0, 8 Jul 2014. Supports the equatorial radius of 6,378,137.0 metres, which gives the circumference of 40,075 kilometres at the equator.
- Swedish Environmental Protection Agency and Statistics Sweden, Kvalitetsdeklaration, Utsläpp till vatten och slamproduktion, referensår 2022 (Quality declaration, discharges to water and sludge production, reference year 2022), 19 Feb 2025. Supports that the target population is municipal wastewater treatment plants that need a permit and serve at least 2,000 population equivalents, that is the boundary behind the figure of 433.
- The industry body Svenskt Vatten, P94 tillgänglig i Vattenbokhandeln (P94 available in the water bookshop), 1 Jul 2024, and the municipalities of Kronoberg County, ABVA, Allmänna bestämmelser för brukande av den allmänna vatten och avloppsanläggningen i kommuner i Kronobergs län (General terms for using the public water and sewerage system in the municipalities of Kronoberg County), points 4 and 5. Supports that the industry body's model text exists and is called P94, and the wording that the utility does not guarantee a particular water pressure or amount of water and that the property owner must reduce their use as the utility instructs.
- Swedish Food Agency, Lagstiftning vid prioritering av nödvatten (Legislation on prioritising emergency water), in-depth supplement to the guide to planning emergency water supply, edition 1, September 2017. Supports that no legislation clearly regulates the prioritisation of drinking water.
- Swedish Food Agency, VAKA, nationell vattenkatastrofgrupp (VAKA, national water emergency group), read 13 Sep 2026. Supports the group's remit and that it is on standby around the clock every day of the year.
Links retrieved 9 Sep 2026.
Extended on 13 Sep 2026 with the Swedish Food Agency's page on drinking water, the agency's in-depth supplement on legislation for prioritising emergency water and the page on the national water emergency group, the quality declaration for the statistics on discharges to water, the industry body's model text for municipal regulations together with an adopted municipal ABVA, and the standard document for the World Geodetic System 1984. The charge statistics report gives the average for model house A as 12,537 kronor, while the municipality file gives 12,547.22 kronor; the article follows the municipality file, which is also what the source entry says. Figure 2 of the report gives the median connection charge as 184,779 kronor, while the municipality file gives 192,418 kronor; the article follows the report.