OWN THE FUTURE · SEASON 4 · CLIMATE & RESOURCE SCARCITY
Who farms Sweden's farmland?
The food on your plate has passed through farming, transport and processing before you see it. We explain how the food chain is built and how much land, water and energy it uses.
Published 10 Sep 2026 · About 13 minutes to read
During the Second World War, Sweden had an authority for food. Through four ordinances in 1939, every municipality could be required to set up a wartime board, and the country was divided into wartime districts that usually, but not always, followed a county.14 A newly created ministry of supply led the work, with five central commissions under it and a price control board alongside.14 There were ration cards for most foods and also for clothes, shoes and motor fuel.14 Fish was not rationed.14
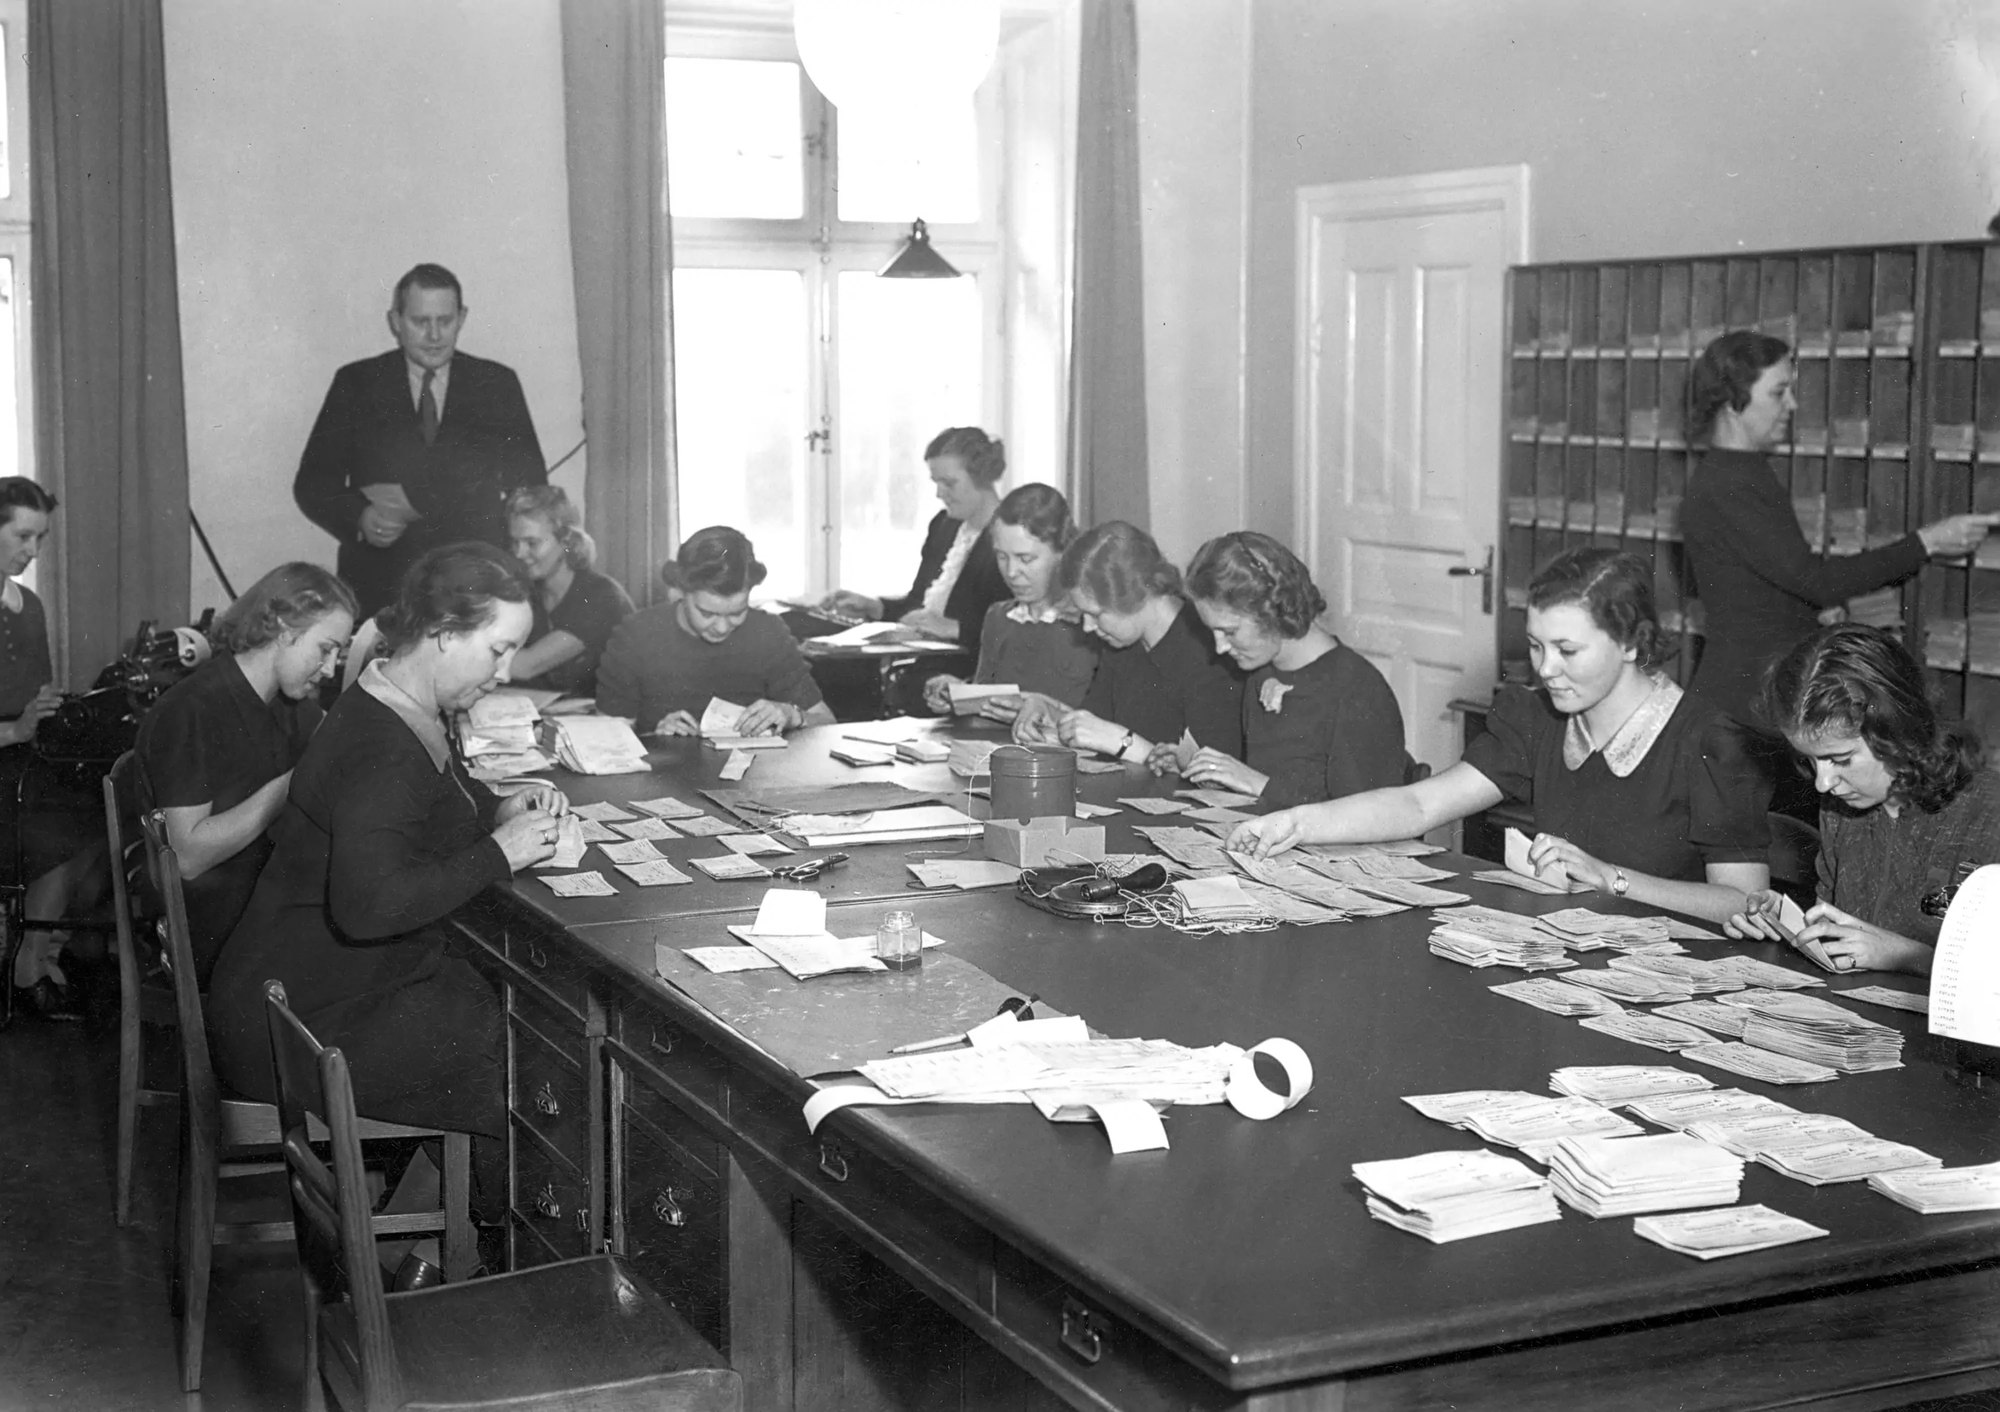
By 1950 all rationing had been lifted except for coffee, and the remaining tasks of the wartime boards were handed over to the county administrative boards.14 The apparatus disappeared, but the chain remains. This article counts it up link by link: the land, the farm businesses, the processing, the shops, and how much land, water and energy it all uses.
Six links, according to the Swedish Parliament's definition
In 2017 the Swedish Parliament adopted a food strategy that defines the chain in six links: primary production, the food industry, food retail, the restaurant trade, food tourism and the consumer.15, 17 The definition still applies, and it is broader than what the statistics measure. The agencies' sector statistics count four subsectors and leave out the consumer.6 The waste statistics count seven links and include households.10 Every figure below therefore carries its own breakdown.
Link one: the land
Sweden's agricultural land was 2,979,000 hectares in 2025.1 Of this, 2,526,900 hectares was arable land and 452,100 hectares pasture and hay meadow.1 So arable land is 85% of agricultural land, and the three terms must be kept apart in every sentence that contains an area.1
The figure does not measure land but applications for support. The Swedish Board of Agriculture (Jordbruksverket) bases its area statistics on what businesses apply for farm support for, and the agency itself writes that changes in the support systems have affected the definition of pasture.1 The pasture area can therefore move in the statistics without a single paddock having disappeared.
Agricultural land is just over 7% of Sweden's land area of 409,628 square kilometres.1 It is spread extremely unevenly. In Skåne County the share is just over 44% and in Trelleborg Municipality just over 80%, while 90 of the country's 290 municipalities are below 5%.1
Counted per inhabitant, arable land comes to 2,387 square metres, about a third of a football pitch per person.1, 18 All agricultural land gives 2,814 square metres.1, 18 That puts Sweden 1.40 times above the world average for arable land per person, which was 0.1717 hectares in 2023 against Sweden's 0.2397.13
418,644 became 54,700
In 1937 the Swedish arable area was 3,731,038 hectares. The highest level ever measured is 3,790,496 hectares, from 1919.3, 19, 20 In 1937 there were 418,644 farm holdings.3, 21 Today the arable area is 2,526,900 hectares and the farm businesses number 54,700.1, 2
How to read the two figures
The land shrank by 32.3%. The farm businesses shrank by 87%.1, 2, 19, 21 These are the most important figures in the whole subject, and the two must be read together.
The comparison needs a caveat that is rarely spelled out. In 1937 the statistics counted every holding, even the very smallest, and 111,325 of the 418,644 were under two hectares.21 From 1956 the series on the number of farm businesses only reports those with more than two hectares of arable land.21 Counting only holdings over two hectares, the figure was 307,319 in 1937, and the fall to today's 54,700 is then 82% instead of 87.2, 21 The order of magnitude holds in both cases; the exact percentage does not.
Fewer businesses, larger farms
The average area shows the same thing from the other side. In 1937 there were 8.9 hectares of arable land for each farm.19, 21 In 2025 it is 46.2 hectares counted across all businesses, and 49 hectares counted across the businesses that actually have arable land, which is the Swedish Board of Agriculture's own measure.1, 2
The concentration continues among today's farmers. Of the 54,700 businesses, 34,500 farm twenty hectares or less, and together they have 10% of the arable land.2 At the other end there are 6,700 businesses with more than a hundred hectares. They are 12.2% of the businesses and farm 65% of the land.2 Nearly half of the arable land, 45% at the latest count in 2023, is also rented.2
The people who do the work outnumber the businesses. In 2023, 158,300 people worked at least a hundred hours in farming, which was equal to 53,300 full-time years of work.2 Of these, 90,200 were men and 68,100 women.2 The age profile has shifted: about 40% of farmers who were sole traders were 65 or older in 2025, against just under 31% in 2013.2
On a European scale, Swedish farms are large. The average utilised agricultural area per farm in 2020 was 51.1 hectares in Sweden against 17.1 hectares in the EU27, three times as much.12 The structural change is not Swedish, though: the EU27 had 9,067,520 farms in 2020 against 10,650,640 in 2013, a fall of 14.9% in seven years, while Sweden's number fell by 12.5% over the same period.12
The chain is wide where you think it is narrow
Primary production is the part of the chain everyone pictures, and it is the smallest of the links counted in people. In 2022, 395,000 people were employed in the four subsectors of the food sector.6 Retail and wholesale had just over 148,000, the restaurant trade about 145,000, the food industry just over 53,000 and primary production about 47,000.6
Counted in workplaces, the picture is reversed. The 395,000 are spread over just over 125,000 workplaces, and primary production has just over 73,000 of them, that is 58%.6 With 12% of those employed, farming has nearly six in ten workplaces in the whole chain.6 The restaurant trade has about 29,000 workplaces and the food industry 4,900.6
The industry link is also small-scale. Of the food industry's workplaces, 87% had zero to nine employees in 2022.6 There are just over 5,000 plants in Sweden that process food, and just over one in five is in Västra Götaland County.5 Together with Skåne and Stockholm counties, that county holds about half of all plants.5
Value added in 2022 was split into just over 34 billion kronor in primary production, just over 53 billion in the food industry, just over 53.5 billion in retail and just over 31.6 billion in wholesale, a total of 172.1 billion kronor. The restaurant link's just over 58 billion is outside that total.6 Farming's own production value was estimated provisionally at 90.7 billion kronor in 2025, with costs for inputs and services of 56.6 billion and a business income of 16.3 billion.2
At the far end of the chain, retail sales of food and soft drinks were 349 billion kronor in 2024, a rise of 16 billion on the year before.2
Self-sufficiency has no single figure
The question of how self-sufficient Sweden is has no answer because it has no measure. Four different measures are used, and they give four different pictures.4, 5
The first is the self-sufficiency rate by product group, that is the country's production of a product divided by the country's total consumption of it over a year. The Swedish Board of Agriculture follows eighteen groups, and for 2025 the results range from 19% for tomatoes to 150% for cereals.4 In between are sugar at 103, carrots 99, eggs 97, potatoes for eating 90, pork 81, milk 73, all meat 70, beef 54, apples 31 and mutton and lamb 23%.4
is the range between the lowest and the highest self-sufficiency rate among the eighteen product groups the Swedish Board of Agriculture followed in 2025. There is no single figure for Swedish self-sufficiency.
SOURCE: SWEDISH BOARD OF AGRICULTURE, SELF-SUFFICIENCY RATES 2025The second measure counts in energy. In a report from September 2025, the Swedish Food Agency (Livsmedelsverket) and the Swedish Board of Agriculture calculated that Swedish food production was equal to 3,530 kilocalories per person per day over the period 2013 to 2023, after deducting waste up to the consumer.5 The corresponding EU figure for 2023 was 4,340 kilocalories.5
The third expresses the same thing in people: according to the same report, Swedish production is in theory enough for about 14 million people.5 The fourth is net imports in calories, which averaged just over 300 kilocalories per person per day over 2017 to 2024, with exports of 2,240 and imports of 2,920 kilocalories in 2024.5 About 70% of food trade takes place within the EU single market.5
Counted in kronor, exports of agricultural products and food were 149.3 billion in 2025 and imports 243.2 billion.2 So imports were 1.63 times exports, and net imports 93.9 billion kronor.2 The largest category in both directions was fish, crustaceans and molluscs, with 57 billion out and 65 billion in, which the Swedish Board of Agriculture explains by Norwegian fish being transported through Sweden.2
The four measures must never be mixed in the same sentence without the measure being stated. In March 2025 the government wrote that the players in the food chain are calling for measurable targets, and in April 2025 it asked the Swedish Board of Agriculture to propose how follow-up should be done, with a first checkpoint in 2030.22, 23 The Swedish Board of Agriculture's proposed self-sufficiency targets have not been adopted as formal targets.4, 23
What the chain takes from the country
The land is seven per cent of Sweden. The water is less than you might think. Of Sweden's total freshwater use of 2,529 million cubic metres in 2020, 102 million went to agriculture, that is 4%.7 Industry took 61% and households 23.7 Globally, 72% of freshwater use goes to agriculture, according to the compilation Statistics Sweden (SCB) cites for 2018.7 The difference from Sweden is because Swedish crop farming mostly relies on rainfall.
Irrigation
In 2020 agriculture's 102 million cubic metres consisted of 74 million cubic metres of irrigation water and 28 million cubic metres of drinking water for livestock.7 Irrigation's share has risen from 63% in 2010 to 72% in 2020, and total use rose by 36% between 2015 and 2020.7
Irrigation capacity is small and concentrated. About 5% of Swedish agricultural land can be irrigated, roughly 146,000 hectares, and 89% of that area is in Götaland.8 In 2023 about 2.7% was actually irrigated.8 54% of the water was taken from lakes and ponds and 42% from groundwater.8 The Swedish Board of Agriculture states explicitly that the irrigation surveys have never been published as official statistics, and that should go with the figures.8 The same survey is the source of the finding that 48% of businesses cannot measure how much water they take, and that 93% do not pay by volume.8
Energy
The energy can be counted exactly. Agriculture's final energy use was 5,791 gigawatt hours in 2024, that is 5.791 terawatt hours.9, 24 Petroleum products accounted for 2,415, biofuels for 1,819 and electricity for 1,493 gigawatt hours.9, 24 The electricity use is equal to 1.2% of Sweden's electricity use without losses in 2024, which was counted up in S4:E1 Clean Energy.24
The direction has been downwards. Energy use has fallen by 20.2% since 2005, from 7,255 to 5,791 gigawatt hours, while the share of biofuels has risen from 10.6 to 31.4%.9, 24 The agricultural sector's greenhouse gas emissions were 6.3 million tonnes of carbon dioxide equivalent in 2024, unchanged from 2023, of which 2.4 million tonnes came from arable land and pasture.2
What the chain throws away
Food waste and edible food waste are two different measures, and mixing them up is the most common mistake in the subject. Food waste is everything thrown away, including peel, bones and coffee grounds. Edible food waste is the part that could have been eaten.
Sweden's food waste was 122 kilos per person in 2023.10 Households accounted for 60 kilos, the food industry 29, primary production 9, restaurants and hotels 9, food shops 8, public meals 4 and wholesale 2.10 The links add up to 121 while the source's total line gives 122, and the difference is rounding in the source.10
Of households' 60 kilos, about 16 kilos was edible food waste and 45 kilos other food waste.10, 25 On top of that, an estimated 190,000 tonnes of food is poured down the drain every year, about 18 kilos per person, which does not show up in the waste statistics at all.10
In the retail and consumer link, 880,000 tonnes of food waste arose in 2024, equal to 84 kilos per person, of which households accounted for 72%.10, 25 The shops' own waste was 35% fruit and vegetables, 25% dairy and chilled goods, 14% meat and cold cuts and 12% bread.10
Sweden's interim target was for food waste to fall by at least 20% by weight per person between 2020 and 2025.10, 25 The amounts have not fallen.10, 25 The EU's revised Waste Directive sets binding targets for 2030 of minus 30% per person in the retail and consumer link and minus 10% in the food industry.10, 26
Sweden is close to the EU average. Eurostat gives 122 kilos per person for Sweden and 129 for the EU27 in 2023, that is 5.4% below the average, with households at 60 and 69 kilos respectively.11
What consumption has done since rationing
Statistics Sweden's consumption series starts in 1939, the same year as the wartime boards.3, 27 It measures total consumption divided by the population and not what any individual eats, but it shows the make-up clearly.
Drinking milk was at 194.9 litres per person per year in 1939 and rose to 222.7 litres in 1950.27 In 2000 it was 113.9 litres and in 2025 provisionally 59.1 litres, that is 69.7% below the 1939 level.2, 27 Meat went the other way: 48.0 kilos in 1939, 64.0 kilos in 1980, 82.9 kilos in 2007 and provisionally 79.9 kilos in 2025, a rise of 66.5% since 1939.2, 27
Flour fell from 96.8 kilos in 1939 to 71.3 kilos in 2007, and rye flour on its own from 26.1 to 8.5 kilos.27 That is roughly the period when the arable area and the number of farm businesses fell, and the two series belong together without one explaining the other.
What the figures do not say
The dates are all over the place. The areas refer to 2025, the numbers of businesses to 2025, employment in farming to 2023, employment in the whole sector to 2022, water to 2020, energy to 2024, and food waste to 2023 for the whole chain and 2024 for the retail and consumer link.1, 2, 6, 7, 10, 24 That is why every figure in this article carries its own date.
Swedish and European figures do not measure the same thing. Eurostat gives Sweden's utilised agricultural area in 2020 as 3,005,810 hectares and the number of farms as 58,790, while the Swedish Board of Agriculture gives 2,979,000 hectares and 54,700 businesses for 2025.1, 2, 12 The figures are close but rest on different boundaries and different years, and they do not belong in the same sentence.
Organic production covered 474,300 hectares in 2025, that is 16% of agricultural land, a fall of 21,400 hectares from 2024.2 The share has fallen since 2019.
Two counties carry a disproportionate part of the chain. Skåne and Västra Götaland together account for over half of the country's food production counted in calories.5 In September 2025 the Swedish Food Agency and the Swedish Board of Agriculture estimated that grocery retailers' stocks are equal to about two weeks of consumption without restocking.5 During the Second World War, the answer to the same question was an authority, a card and a coupon.
What to take away
Sweden's agricultural land was 2,979,000 hectares in 2025 and was farmed by 54,700 businesses, against 418,644 farm holdings in 1937: the land shrank by 32.3% and the businesses by 87%.1, 2, 19, 21 Concentration is the lasting feature. Today 6,700 businesses with more than a hundred hectares farm 65% of the arable land, 45% of the arable land was rented in 2023, and about 40% of sole-trader farmers were 65 or older in 2025.2 Follow the Swedish Board of Agriculture's area statistics and its compilation of agricultural statistics, the agency's self-sufficiency rates by product group, which in 2025 were between 19 and 150%, and the Swedish Environmental Protection Agency's statistics on food waste, 122 kilos per person in 2023.1, 2, 4, 10
The next episode is S4:E5 Circular Economy, about what happens to our rubbish and how much becomes new material.
Education, not advice.
The fund
Behind the library stands a fund.
Own The Future is published by AIX. The library is the knowledge; AIX Dynamic is the tool, a systematic securities fund (UCITS) that follows the trend and steps aside when risk rises.
This is marketing. Fund units can both rise and fall in value. Read the key information document (KID) and the prospectus before you invest; you will find them on the fund's page at Avanza.
34 UNITHOLDERS · AS OF 15 SEP 2026The future in your inbox.
The most important things from each area, without the noise and without the hype.
Sources
- Swedish Board of Agriculture (Jordbruksverket), Jordbruksmarkens användning 2025, slutlig statistik (Use of agricultural land 2025, final statistics), published 22 Oct 2025. Agricultural land of 2,979,000 hectares, arable land of 2,526,900 hectares, pasture and hay meadow of 452,100 hectares, the share of the land area and the extremes by county, and that the statistics are based on applications for support.
- Swedish Board of Agriculture, Jordbruksstatistisk sammanställning 2026 (Compilation of agricultural statistics 2026), published 23 Jun 2026. The 54,700 farm businesses, the average area of 49 hectares, the size distribution, the share rented, employment in 2023, the age profile, the production value, foreign trade in 2025, food sales in 2024, the organic area and greenhouse gas emissions.
- Statistics Sweden (SCB), Allmän jordbruksstatistik, historiska tabeller (General agricultural statistics, historical tables). The peak of the arable area in 1937 at 3,731,038 hectares, the number of farm holdings 1927 to 2007 with size classes, and consumption per person of milk, meat and flour from 1939. The figures for 1937 and the consumption series were taken directly from the database by the editors. The series on the number of farm businesses, Kap1T07, only reports businesses with more than two hectares of arable land from 1956. In the area series Kap1T01 the corresponding boundary was introduced in 1961.
- Swedish Board of Agriculture, Priser och marknadsinformation för livsmedel (Prices and market information for food), the section on following up targets for Swedish food production, last reviewed 4 Sep 2026, and the underlying file Detaljerad uppföljning av mål för svensk livsmedelsproduktion (Detailed follow-up of targets for Swedish food production). The sheet Målförslag (Proposed targets) gives the results for 2025 for eighteen product groups, from 19% for tomatoes to 150% for cereals. One sheet per product group gives production, imports, exports and total consumption in thousand tonnes, with the self-sufficiency rate worked out as production divided by total consumption.
- Swedish Food Agency (Livsmedelsverket) and Swedish Board of Agriculture, Livsmedelsförsörjningen i siffror, nyckeltal och indikatorer (Food supply in figures, key figures and indicators), 102 pages, September 2025. The summary on pages 5 to 7 gives the 3,530 kilocalories per person per day for the period 2013 to 2023, the EU's 4,340 for 2023, the theoretical 14 million people, exports of 2,240 and imports of 2,920 kilocalories for 2024, the just over 70% of trade within the EU single market, the two counties' share of calorie production and the estimate of about two weeks of stocks. The basis for the calorie measure is on page 28 and for the trade measure on page 37.
- Swedish Agency for Economic and Regional Growth (Tillväxtverket), statistik och analys om livsmedelssektorn (statistics and analysis on the food sector). The 395,000 employed in four subsectors in 2022, the just over 125,000 workplaces, the size distribution in the food industry and value added by subsector.
- Statistics Sweden, Vattenanvändningen i Sverige 2020 (Water use in Sweden 2020), report MI 27 BR 2201. Freshwater use of 2,529 million cubic metres and the split between industry, households, other uses and agriculture, agriculture's split between irrigation and livestock, and the global figure of 72%.
- Swedish Board of Agriculture, undersökningen om bevattning och dränering 2023 (survey of irrigation and drainage 2023). The roughly 146,000 hectares that can be irrigated, the 2.7% that was irrigated, the water sources, the ability to measure, and the agency's own statement that the results are not official statistics.
- Swedish Energy Agency (Energimyndigheten), energistatistik för jordbruket (energy statistics for agriculture). Final energy use of 5,791 gigawatt hours in 2024, the split by energy carrier and the comparison with 2005.
- Swedish Environmental Protection Agency (Naturvårdsverket), statistik om livsmedelsavfall (statistics on food waste). The 122 kilos per person in 2023 split across seven links, households' split into edible food waste and other, the 880,000 tonnes in the retail and consumer link in 2024, the product groups in shop waste and the interim target.
- Eurostat, food waste by NACE activity. The 122 kilos for Sweden against 129 for the EU27 in 2023, with households at 60 and 69 kilos respectively.
- Eurostat, farm structure survey. The 9,067,520 farms in the EU27 in 2020 against 10,650,640 in 2013, and the average area of 17.1 hectares in the EU27 against 51.1 hectares in Sweden.
- World Bank, arable land, hectares per person, with FAO as the source. Sweden's 0.2397 hectares per person against the world's 0.1717 in 2023.
- Beata Losman, Förvaltningshistorik, kapitel 32 Försörjning med varor och i kristid, avsnitt 5 Andra världskrigets ransonering (History of public administration, chapter 32, supply of goods and in times of crisis, section 5, rationing in the Second World War), Swedish National Archives (Riksarkivet), HTML edition 2005. The wartime boards at municipal and district level under the ordinances of 1939 (SFS 1939:254, 1939:657, 1939:658 and 1939:659), the ration cards for most foods and for clothes, shoes and motor fuel, that fish was not rationed, and that all rationing except for coffee had been lifted by 1950. Link checked 11 Sep 2026.
- The Swedish Parliament (Sveriges riksdag), proposition 2016/17:104, En livsmedelsstrategi för Sverige (Government bill 2016/17:104, A food strategy for Sweden). The definition of the food chain in six links.
- Kalmar County Museum (Kalmar läns museum), samlingsposten KLMF.B03255 (collection record KLMF.B03255) on DigitaltMuseum. The photograph from the post office in Kalmar in the 1940s, photographer Walter Olson, licence Public Domain Mark.
- The Swedish Parliament, Miljö- och jordbruksutskottets betänkande 2016/17:MJU23, En livsmedelsstrategi för Sverige (Report of the Committee on Environment and Agriculture 2016/17:MJU23, A food strategy for Sweden), 2017. Supports that it was the Swedish Parliament that took the decision in 2017 and that the six-link definition is part of the basis for that decision.
- Statistics Sweden's Statistical Database (SCB Statistikdatabasen), Folkmängden efter ålder och kön, år 1860 till 2024 (Population by age and sex, 1860 to 2024), 2025. Supports the denominator of 10,587,710 inhabitants on 31 Dec 2024 behind the figures in square metres per inhabitant.
- Statistics Sweden's Statistical Database, Ägoslagsareal i hektar efter region, ägoslag och år, 1866 till 2007 (Land use area in hectares by region, type of land and year, 1866 to 2007) (table Kap1T01). Supports the arable area of 3,731,038 hectares in 1937 for the whole country, the peak of 3,790,496 hectares in 1919 and the two-hectare limit in the land use series from 1961.
- Swedish Board of Agriculture and Statistics Sweden, Jordbruket i siffror åren 1866 till 2007 (Agriculture in figures, 1866 to 2007), chapter 1. Supports that the peak of the arable area was 3,790,496 hectares in 1919 and that the level was kept until the mid-1950s.
- Statistics Sweden's Statistical Database, Jordbruksföretag, antal efter region, storleksklass och år, 1927 till 2007 (Farm holdings, number by region, size class and year, 1927 to 2007) (table Kap1T07). Supports 418,644 farm holdings in 1937, 111,325 under two hectares, the total over two hectares of 307,319, and that the class under two hectares has no values from 1956.
- Government Offices of Sweden (Regeringskansliet), Livsmedelsstrategin 2.0 (The food strategy 2.0), 21 Mar 2025. Supports the government's wording on measurable targets, the examples of market shares and that the Swedish Board of Agriculture is to be given the task with a checkpoint in 2030.
- Government Offices of Sweden, Ministry of Rural Affairs and Infrastructure (Landsbygds- och infrastrukturdepartementet), Uppdrag till Statens jordbruksverk att lämna förslag för mätning och uppföljning av livsmedelskedjans utveckling samt att beskriva möjliga målformuleringar (Commission to the Swedish Board of Agriculture to propose ways of measuring and following up the development of the food chain and to describe possible targets), LI2025/00784, government decision 10 Apr 2025. Supports the commission itself, the requirement for a first checkpoint in 2030, and that the Swedish Parliament approved the food strategy on 20 Jun 2017.
- Swedish Energy Agency, statistical database, Jordbrukets slutliga energianvändning fördelat på energislag, 2005 och framåt (Final energy use in agriculture by type of energy, 2005 onwards). Supports the total of 5,791 gigawatt hours in 2024 and 7,255 gigawatt hours in 2005, petroleum products 2,415, biofuels 1,819 and electricity 1,493 gigawatt hours in 2024, and biofuels' 766 gigawatt hours in 2005.
- Swedish Environmental Protection Agency, Livsmedelsavfall och matsvinn 2024, statistikblad (Food waste and edible food waste 2024, statistics sheet), 18 Dec 2025. Supports 880,000 tonnes and 84 kilos per person in 2024, households' share of 72%, and the split into 16 kilos of edible food waste and 45 kilos of other food waste.
- The European Parliament and the Council, Direktiv (EU) 2025/1892 om ändring av direktiv 2008/98/EG om avfall (Directive (EU) 2025/1892 amending Directive 2008/98/EC on waste), 10 Sep 2025. Supports the binding targets for 2030, minus 10% in food processing and manufacturing and minus 30% per person in the retail and consumer link.
- Statistics Sweden's Statistical Database, Totalkonsumtion av vissa varor, år 1939 till 2007 (Total consumption of certain goods, 1939 to 2007) (table Kap10T02). Supports drinking milk of 194.9 litres in 1939, 222.7 litres in 1950 and 113.9 litres in 2000, meat of 48.0 kilos in 1939, 64.0 kilos in 1980 and 82.9 kilos in 2007, flour and groats of 96.8 kilos in 1939 and 71.3 kilos in 2007, and rye flour of 26.1 and 8.5 kilos.
Links retrieved 9 Sep 2026.
Extended on 13 Sep 2026 with the individual historical Statistics Sweden tables behind the 1937 figures and the consumption series, Statistics Sweden's population as denominator, the Swedish Energy Agency's table of energy use in agriculture, the Swedish Environmental Protection Agency's statistics sheet, the Swedish Parliament's committee report on the food strategy, the government's commission on measurable targets and the EU's revised Waste Directive. The Swedish Environmental Protection Agency's table gives households' food waste as 60 kilos per person, while the statistics sheet gives 16 kilos of edible food waste and 45 kilos of other, together 61; the difference is rounding in the source. The Swedish Board of Agriculture's compilation gives the organic area in one place as just under 15% of agricultural land and in another as 16%; the article follows the latter.