OWN THE FUTURE · SEASON 5 · EMERGING GLOBAL WEALTH
What is the middle class, and who counts as part of it?
Middle class is a term that is used often and defined rarely. We explain how economists measure it and what the statistics show about incomes in different countries.
Published 10 Sep 2026 · About 10 minutes to read
In 1982 Statistics Sweden (SCB) published an official classification of everyone in work in Sweden.7, 14 It was called the socio-economic classification, SEI for short, and in the agency's aggregated version it sorted people in work into twelve groups by occupation.7, 13 The criterion was how many years of education after compulsory school the occupation normally required, not what the individual person had studied.13, 14
The groups were unskilled workers and skilled workers, both split into goods production and service production, lower white-collar employees at two levels, intermediate white-collar employees, higher white-collar employees, senior positions, self-employed professionals with graduate occupations, business owners and farmers.13 Employees were divided into blue-collar workers and white-collar employees according to which family of trade unions the occupation normally belonged to.13, 14
In the middle of the classification sat group 46, intermediate white-collar employees. Three years after compulsory school were required, six years were not.13 That is as close to an official Swedish middle class as the statistics ever came, and the group was defined neither by income nor by self-image.
Statistics Sweden phased out SEI from 2026. The agency's own reasoning is that the classification was already out of date in the early 2000s, that the changes to the education system after the 1980s were never reflected in it, and that several occupations had come to require higher qualifications.7 No new Swedish classification replaced it. So Sweden had an official sorting of the population into layers for forty-four years, and it never contained the words middle class.7, 13
This article goes through how the term is actually measured, what answers the different measures give for the same population and why the answers differ by a factor of ten.
Three rulers
Economists measure the middle class in three fundamentally different ways, and they answer different questions.
The first is an absolute band. You set a floor and a ceiling in dollars per day, adjusted for purchasing power, and count how many people fall in between. The measure is built for global comparisons, where the question is what a person can afford. The World Bank's platform reports the share below any given dollar line for most countries in the world.10
The second is a relative band around the median in a country. The OECD uses 75% to 200% of median income and splits the band into lower, middle and upper middle class.9, 16 Pew Research Center, a non-partisan American research institute, uses two thirds to 200%.22, 24 The measure answers where someone stands compared with their fellow citizens.
The third is an occupational or class scheme of the same kind as SEI. It answers what someone works with. SEI was phased out from 2026, but occupations can still be described with the Swedish occupational classification SSYK, and ESeG is a European socio-economic classification.7 Neither of them is the same class scheme as SEI.
Five choices made before the threshold
Before you even get to the percentages, five decisions have already been made, and each one moves the answer.
Which concept of income is used is the first. Statistics Sweden counts disposable income, after taxes and benefits, and publishes two versions: one with realised capital gains and one without. The difference is not negligible. With capital gains, 13.1% of the population had a low economic standard in 2024 and the Gini coefficient was 0.314.2 Without capital gains the figures were 12.8% and 0.288.2
Which equivalence scale is used is the second. The household's income is divided by a number that depends on how many people have to live on it. Statistics Sweden counts a person living alone as 1.00, a cohabiting couple as 1.51, each additional adult as 0.60, the first child under 20 as 0.52 and each additional child as 0.42.5, 6 The OECD instead uses the square root of the household size.16, 23 The same family gets a different income per consumption unit depending on which scale is chosen.
The three remaining choices are which year is meant, which population is counted and whether the unit is the household or the individual. The year is especially treacherous in this subject, because the sources are out of step: Swedish register data refer to 2024, the World Bank's Swedish figures refer to income year 2023, and Eurostat's Swedish values labelled 2024 also refer to income year 2023.4, 10
Same population, three answers
You can lay all three rulers on the same population and see what happens. The data are Statistics Sweden's cut-off values for each percentile of the Swedish income distribution in 2024, plus the World Bank's figures for Sweden.1, 10
With an absolute band of 8.30 to 25.00 dollars per day, about 7.3% of Swedes end up in the middle class, based on the World Bank's data for 2023.10 Almost everyone else is above the ceiling. Our own calculations on Statistics Sweden's data for 2024 give about 66.1% with the OECD's lines of 75% to 200% of the median and about 74.0% with Pew's lines of two thirds to 200%.1, 9, 22 The two relative figures are interpolations on Statistics Sweden's consumption unit scale, not the OECD's or Pew's own estimates with their household scales.
All three figures are correct. The difference between 7% and 66% depends on which question the measure asks. It says nothing about how Swedes are doing.
of Swedes are middle class, depending on whether you measure with our absolute band or with the OECD's relative one. Both figures are correct.
SOURCE: WORLD BANK AND STATISTICS SWEDEN, OUR OWN CALCULATIONOne caveat belongs to the absolute figure. The World Bank publishes no official line for a global middle class. The floor of 8.30 dollars is the bank's own poverty line for upper middle income countries, while the ceiling of 25.00 dollars is our choice.19 A different ceiling gives a different figure.
What it means in kronor
The median and the thresholds per month
The median economic standard in Sweden in 2024 was 327,255 kronor a year.5 For a person living alone, who counts as one consumption unit, that is 27,271 kronor a month after taxes and benefits.5
The thresholds then fall here. Statistics Sweden's line for a low economic standard, 60% of the median, is at 16,363 kronor a month.5 The OECD's floor for the middle class, 75%, is at 20,453 kronor.5, 9 The ceiling that both the OECD and Statistics Sweden use, 200%, is at 54,543 kronor. Above that line, Statistics Sweden counts you as having a high economic standard, and 7.2% of the population were there in 2024.2, 3
Below the line, and counted for a household
Being below 60% of the median is called a low economic standard in Sweden, and Statistics Sweden itself writes that it is not necessarily the same as being poor.3, 4 The EU calls the same measure at risk of poverty.4 The Ministry of Finance reports both measures for the same year in its report on income distribution. With an absolute basket measure, 3.9% of the population had a low income standard in 2024, about 400,000 people, while the relative measure gave 13.1%, just over 1.3 million.8, 15 Same population, same year, more than three times as many people.
For a household, the amounts are converted with the consumption unit scale. A cohabiting couple with two children under 20 equals 2.45 consumption units: 1.51 for the couple plus 0.52 for the first child and 0.42 for the second.6 The OECD's band for that household therefore runs from 50,111 to 133,629 kronor a month in disposable income for the whole family.5, 6 Same band, same year, completely different figures.
Relative measures measure position, not level
The band is measured against the home country's median
Because the relative band is measured against each country's own median, it compares positions within each country's income distribution, not living standards between countries. Eurostat reports median income in purchasing power standards, a unit adjusted for price levels, and there the problem shows straight away.
For 2024 the median was 23,693 purchasing power units in Sweden, 13,023 in Romania and 37,781 in Luxembourg.11, 21 The ceiling for the Romanian middle class, 200% of the Romanian median, is therefore 26,046. That is higher than Sweden's median. The floor for the Luxembourg middle class, 75% of the Luxembourg median, is 28,336, which is above the Romanian ceiling.11, 21 Nobody has changed income in that example. Only country.
The result is that international comparisons of the size of the middle class do not measure how many people are well off. The OECD reports Iceland at 71.9% for 2010 and South Africa at 33.5% for 2012, and that figure describes how compressed the income distribution is.9, 17 A country with evenly spread small incomes gets a large middle class.
For the same reason, the term middle income country does not mean that the country's inhabitants are middle class. The World Bank's country classification groups countries by gross national income per inhabitant, and it says nothing about how incomes are spread within the country.20
The same lines counted in dollars
The difference between the two kinds of measure is clearest if you convert the Swedish line into dollars. Statistics Sweden's line for a low economic standard, 60% of the median, equals just over 33 dollars per day, adjusted for purchasing power.10 The World Bank's line for upper middle income countries is 8.30 dollars, and the bank's international poverty line for low income countries is 3.00 dollars.19 So the Swedish poverty line sits four times above the level that counts as the poverty line in large parts of the world. A relative measure measures the distance to the neighbours, not access to food and a roof.
With the absolute measure, the world looks like this according to the World Bank's estimates for 2024. The series are based on household surveys with estimates for the years in between. Of the world's population of 8,141,808,945 people, 10.40% lived on less than 3.00 dollars per day, 46.07% on less than 8.30 dollars and 77.18% on less than 25.00 dollars.10 The band between 8.30 and 25.00 dollars therefore held about 31.1% of the world's population, roughly 2.53 billion people.10 In Sweden the same band held about 7.3%.
The middle is a place, not a group of people
The strongest Swedish figure on the nature of the middle class comes from the Ministry of Finance's analysis of mobility. Of those who in 2015 were in income group 5 or 6, in the middle of the distribution, almost half had moved to another part of the distribution by the following year.8, 15 Eight years later, in 2024, more than two thirds had left the middle layer altogether, about a third downwards and just over a third upwards.15
Mobility is greatest right in the middle, and the reason is simple. Incomes are packed closely there, so it takes only a small change to switch group. At the far ends of the distribution the distances are larger: income group 10 had 3.2 times the economic standard of the median earner and eight times that of income group 1, which was at about 40% of the median.15
So the middle class as a statistical category is stable. The middle class as a collection of named people is not.
What the figures do not say
The share with a low economic standard does not move in one clear direction. It fell from 14.7% in 2021 to 13.1% in 2024, which according to the Ministry of Finance is the lowest level since 2007.15 The real economic standard of the median earner rose by 16% between 2011 and 2024.15
The OECD has measured how the middle income class changed between the mid 1980s and the mid 2010s in 17 countries.16 Sweden had the largest fall, minus 7.43 percentage points, of which 4.15 went to the lower income class and 3.28 to the higher.18 The OECD average fell from 63.73% to 61.18%.18 Two things belong with that figure: Sweden's middle income class was very large to begin with and, according to the same source, is still larger than the OECD average, and the OECD's Swedish figures are based on EU-SILC and refer to 2013 and 2015.16, 17, 18 So they cannot be set against the calculation on Swedish register data for 2024 as a time series, because the data source, the equivalence scale and the year all differ.
What you can take away is simple. The term middle class has no answer until someone has said which ruler is used, which year is meant and whether the measure is absolute or relative. When someone gives a figure without saying that, the question has not been answered.
What to take away
The same population gives about 7.3% middle class with an absolute band in dollars, about 66.1% with the OECD's relative band and about 74.0% with Pew's.1, 9, 10, 22 The median economic standard was 327,255 kronor in 2024, or 27,271 kronor a month for a person living alone.5 The structural point is that the middle is a place and not a group of people: of those in the middle of the distribution in 2015, more than two thirds had left the middle layer by 2024.15 Mobility is greatest right in the middle, because incomes are packed closely there.15 Follow the median and the percentile cut-offs in Statistics Sweden's income distribution statistics,1, 5 the share with a low economic standard in the Ministry of Finance's report on income distribution15 and the World Bank's dollar lines.19
The next episode is S5:E5 Emerging Capital Markets, about what separates a large capital market from a small one.
Education, not advice.
The fund
Behind the library stands a fund.
Own The Future is published by AIX. The library is the knowledge; AIX Dynamic is the tool, a systematic securities fund (UCITS) that follows the trend and steps aside when risk rises.
This is marketing. Fund units can both rise and fall in value. Read the key information document (KID) and the prospectus before you invest; you will find them on the fund's page at Avanza.
34 UNITHOLDERS · AS OF 15 SEP 2026The future in your inbox.
The most important things from each area, without the noise and without the hype.
Sources
- Statistics Sweden (SCB), Statistikdatabasen (the Statistical Database), the table Fördelning inkomster (fraktiler) efter region, inkomstslag, spridningsmått och år (Distribution of income, percentiles, by region, type of income, measure of spread and year), updated 20 Jan 2026. The cut-off value for each percentile 1 to 99 of the Swedish income distribution, which is the basis for the two relative band calculations.
- Statistics Sweden, Statistikdatabasen, the table Indikatorer inkomstfördelning (Income distribution indicators), updated 20 Jan 2026. Median value, Gini coefficient and the shares with a low and a high economic standard, with and without capital gains.
- Statistics Sweden, Låg och hög ekonomisk standard (Low and high economic standard), short analysis. That a low economic standard is below 60% of the median and a high one is above 200%.
- Statistics Sweden, Att mäta fattigdom (Measuring poverty), in-depth information dated 20 Jan 2026. That there is no single definition of economic vulnerability, that the EU calls the same measure at risk of poverty, and that Eurostat's Swedish value for 2024 refers to income year 2023.
- Statistics Sweden, Gränsvärden för låg ekonomisk standard (Thresholds for a low economic standard), xlsx published 20 Jan 2026, the series 1991 to 2024. The national median of 327,255 kronor in 2024 in current prices.
- Statistics Sweden, Inkomster och skatter, Statistikens framställning HE0110 (Income and taxes, how the statistics are produced, HE0110), dated 20 Jan 2026. The consumption unit scale in full.
- Statistics Sweden, Socioekonomisk indelning (SEI) (Socio-economic classification), documentation page with the aggregated classification. The publication in 1982, the twelve groups, group 46 with the requirement of three but not six years after compulsory school, and the phasing out from 2026 with the agency's own reasoning.
- Ministry of Finance (Finansdepartementet), Fördelningspolitisk redogörelse april 2026 (Report on income distribution, April 2026), annex 2 to the 2026 spring fiscal policy bill. The difference between a low income standard and a low economic standard, the real trend 2011 to 2024, the distances between the income groups and mobility 2015 to 2024.
- OECD, Under Pressure, The Squeezed Middle Class, OECD Publishing 2019. The definition of 75% to 200% of the national median, the split into lower, middle and upper middle income class, the seventeen countries in the measurement of change and the caveats about the Swedish values.
- World Bank (Världsbanken), Poverty and Inequality Platform, the version with 2021 purchasing power parities. The shares of Swedes below 8.30 and 25.00 dollars per day for income year 2023, and the country classification by gross national income per inhabitant.
- Eurostat, Mean and median income by age and sex (ilc_di03), the table view with the unit purchasing power standard. The median incomes for Sweden, Romania and Luxembourg in 2024, when the indicator median equivalised income, the unit PPS, all age groups and both sexes have been selected.
- Pew Research Center (Rakesh Kochhar), The State of the American Middle Class, 31 May 2024. The definition of middle income households as two thirds to double the national median income after adjusting for household size.
- Statistics Sweden, Socioekonomisk indelning (SEI) av förvärvsarbetande, aggregerad indelning (Socio-economic classification of people in work, aggregated classification). The twelve groups in the aggregated classification, the codes 11 to 89, group 46 intermediate white-collar employees with the requirement of three but not six years after compulsory school, the division into blue-collar and white-collar by family of trade unions, and the note that the classification is based on the occupation's normal education requirement and not on the individual's education.
- Statistics Sweden, Socioekonomisk indelning (SEI) 1982, Mis 1982:4, klassindelning och definitioner (Socio-economic classification 1982, class division and definitions). The full classification from 1982, that it covers people in work in eighteen groups with the codes 11 to 87, and that SEI also covers the population not in work in six further groups.
- Ministry of Finance, Fördelningspolitisk redogörelse april 2026, bilaga 2 till prop. 2025/26:100 (Report on income distribution, April 2026, annex 2 to bill 2025/26:100), the full report as PDF. 3.9% with a low income standard in 2024 and about 400,000 people, 13.1% with a low relative economic standard as the lowest level since 2007, the real rise of 16% for the median earner 2011 to 2024, income group 10 with 3.2 times the median earner's standard and eight times income group 1, which is at about 40% of the median, and the mobility analysis for those in income group 5 or 6 in 2015.
- OECD, Under Pressure, The Squeezed Middle Class, OECD Publishing 2019, the full report as PDF. The definition of 75% to 200% of the national median, the split into lower, middle and upper middle income class with the lines 75 to 100, 100 to 150 and 150 to 200 per cent, the square root of household size as the equivalence scale, the seventeen countries with data on the change, that the fall was especially steep in Sweden and Finland, where the middle income class was very large and is still larger than the OECD average, and that the Swedish values are based on EU-SILC for 2013 in the level figure and 2015 in the change figure.
- OECD, Figure 2.1, The middle-income class forms the bulk of the population in almost all OECD countries, underlying data for the 2019 report. Iceland at 71.861756% and South Africa at 33.488113% in the middle income class, Sweden at 65.154449 and the OECD average for thirty-five countries at 61.465864, and the years per country in the note.
- OECD, Figure 2.4, The hollowing-out of middle incomes, underlying data for the 2019 report. That Sweden has the largest fall of the seventeen countries at minus 7.4264177 percentage points, that 4.1499619 percentage points went to the lower income class and 3.2764548 to the upper, and that the OECD average fell from 63.732460% in the mid 1980s to 61.179697% in the mid 2010s.
- World Bank, June 2025 Update to Global Poverty Lines, factsheet 5 Jun 2025. That the international poverty line is 3.00 dollars per person per day in 2021 purchasing power parities, that the line for lower middle income countries is 4.20 dollars and that the line for upper middle income countries is 8.30 dollars.
- World Bank, World Bank country and lending groups, classification page for fiscal year 2027. That countries are grouped by gross national income per inhabitant calculated with the Atlas method, and the four thresholds for 2025 incomes.
- Eurostat, Mean and median income by age and sex (ilc_di03), the table view with the unit purchasing power standard. The median incomes in 2024 for Sweden, Romania and Luxembourg when the indicator median equivalised income and the unit PPS are selected.
- Pew Research Center (Rakesh Kochhar), The State of the American Middle Class, 31 May 2024. The definition of middle income households as two thirds to double the national median income after adjusting for household size, and that lower and upper income households are below and above those lines.
- Pew Research Center, Middle class methodology, 31 May 2024. That household income is divided by the square root of household size and scaled to a three-person household, so the institute's household scale is not the Swedish consumption unit scale.
- Pew Research Center, About Pew Research Center. The institute's description of itself as non-partisan and non-advocacy, that it takes no positions on policy issues, and that it is a subsidiary of, and mainly funded by, an American foundation.
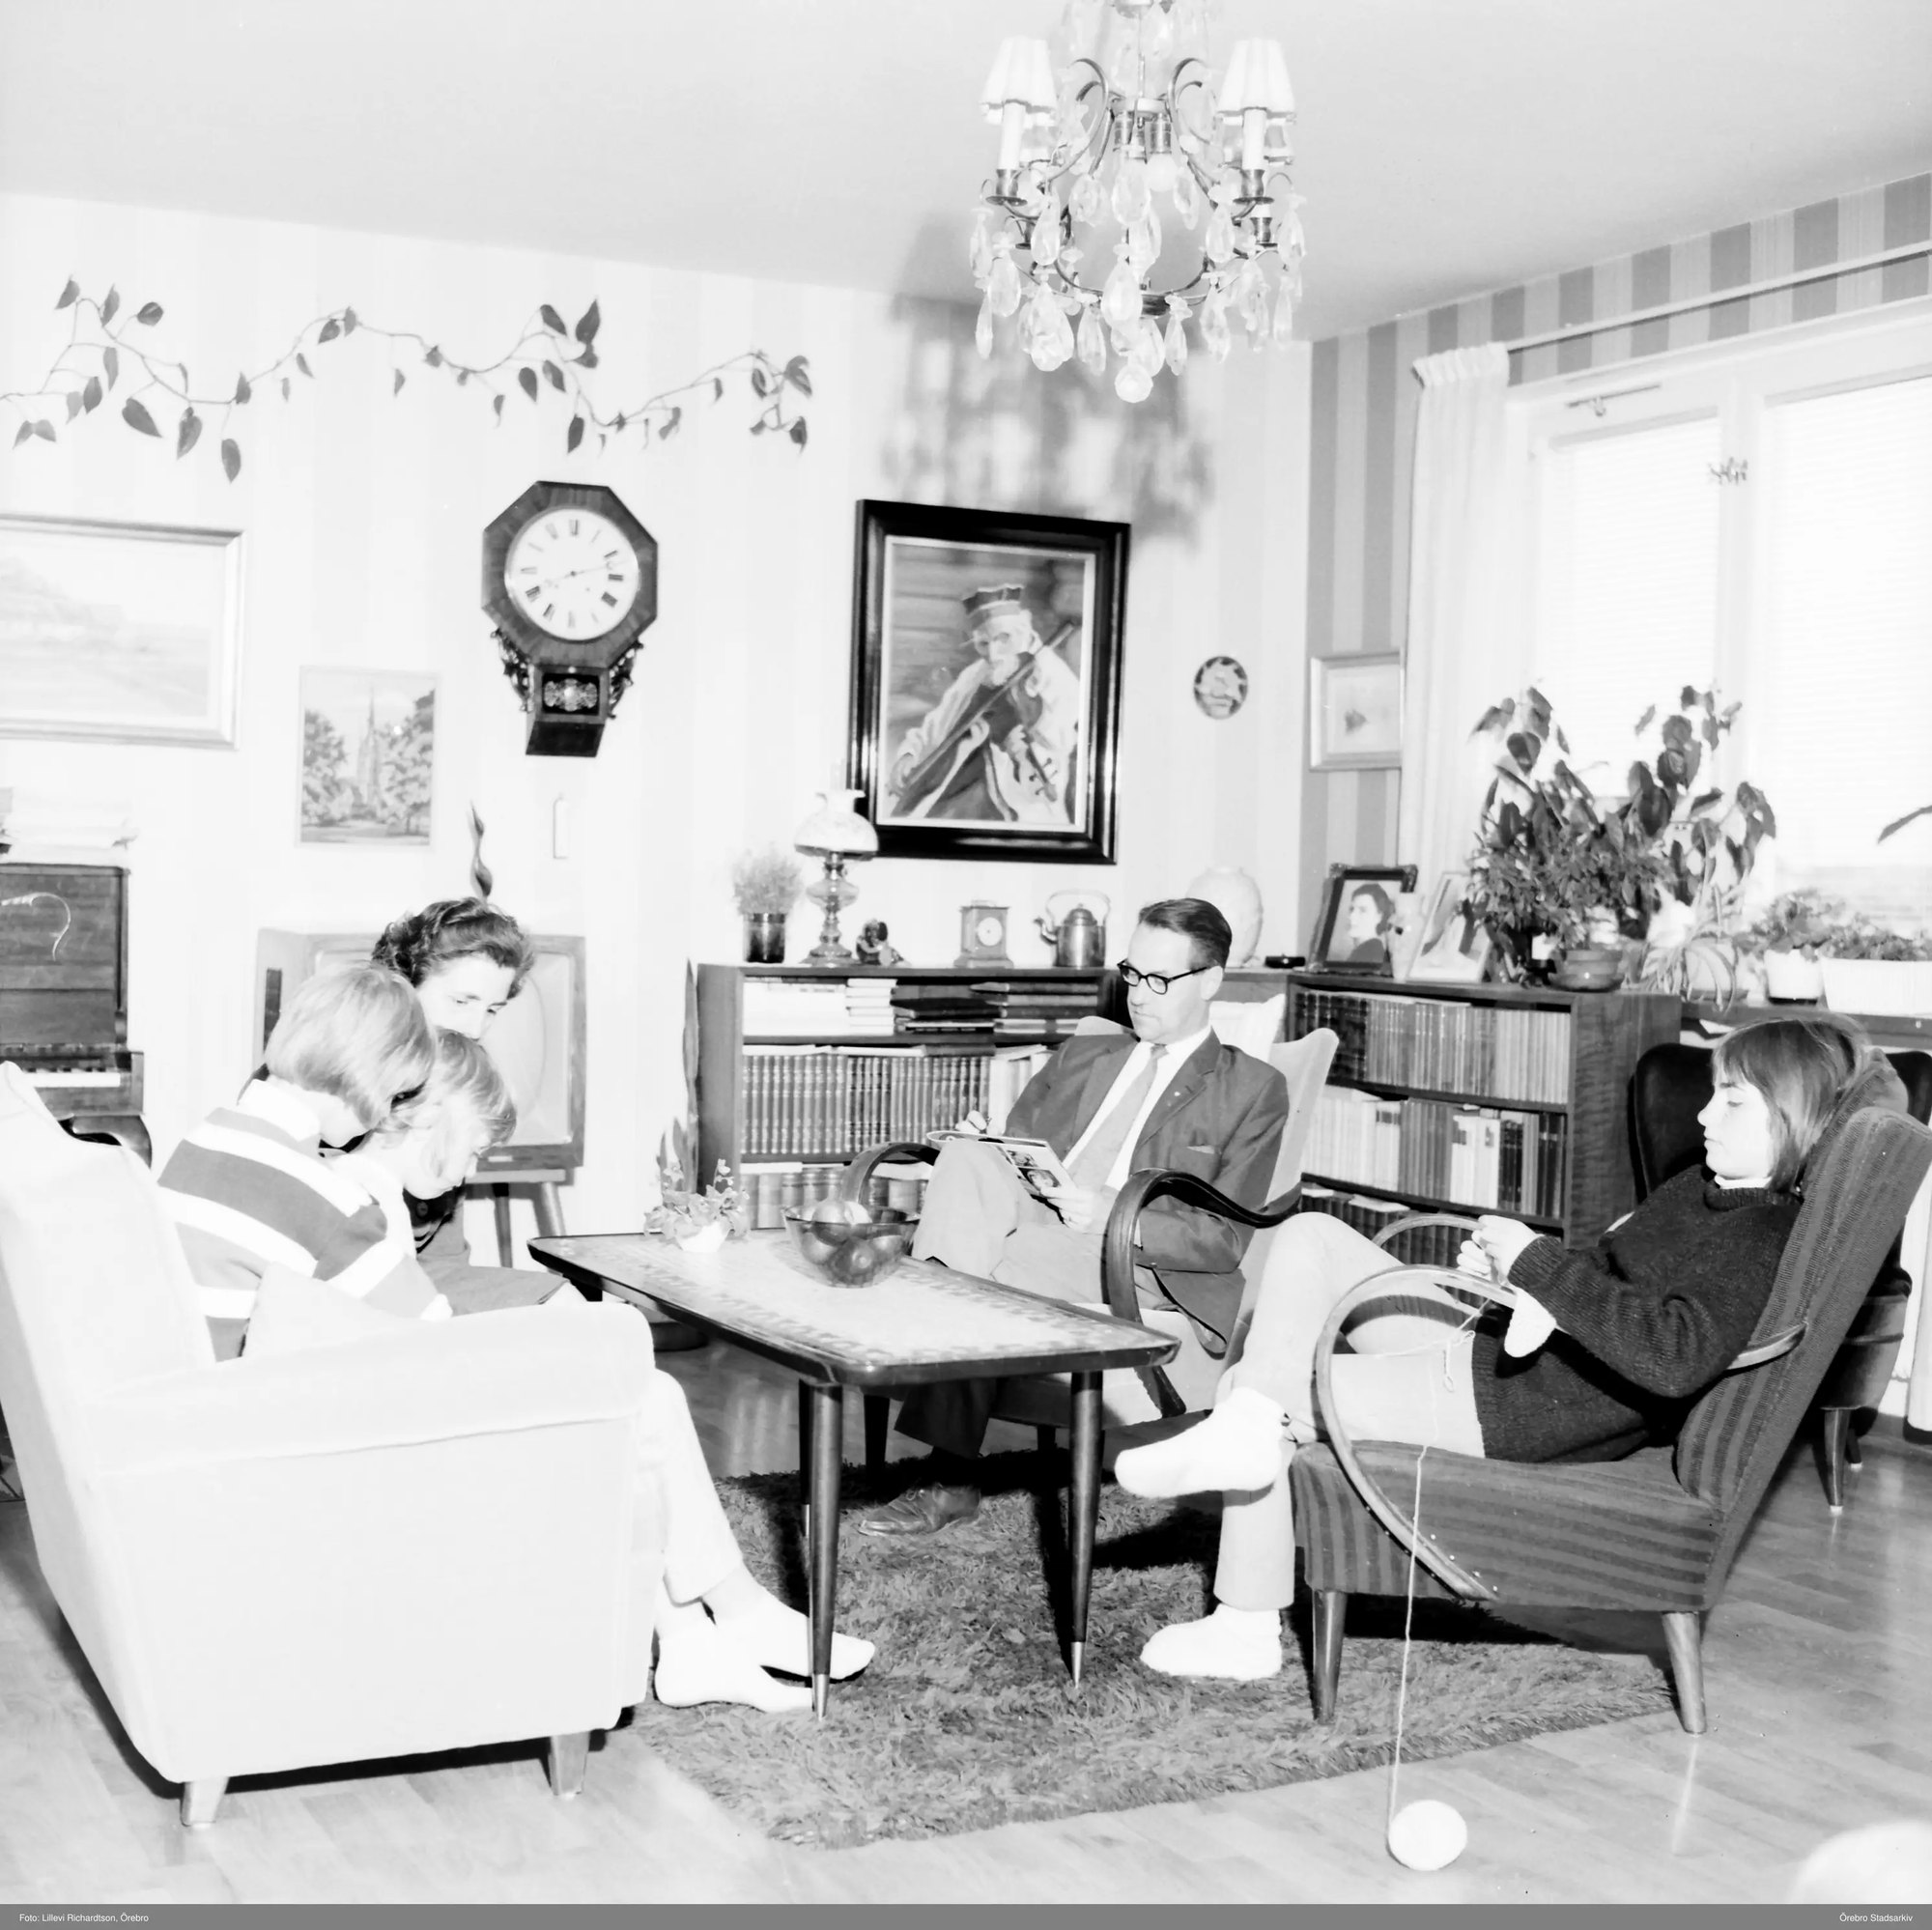
- Örebro City Archives (Örebro Stadsarkiv), Familjen Enbrant i vardagsrummet i Baronbackarna, 1960-tal (The Enbrant family in the living room in Baronbackarna, 1960s), collection record SBK-BA-109 on DigitaltMuseum. The subject, the year of the photograph 1960, the photographer Lillevi Richardtson in Örebro, the owner Örebro City Archives and the CC BY licence.
- Örebro County Administrative Board (Länsstyrelsen i Örebro län), Baronbackarna, cultural heritage page. That the housing estate was built from 1953 to 1957, that it consists of blocks of flats around half-open courtyards and that it is part of an area of national interest for cultural heritage.
- Statistics Sweden, Inkomstfördelningen 1991 till 2023 (The income distribution 1991 to 2023), report published 22 May 2025. That the official Swedish income distribution statistics rest on the sample survey Hushållens ekonomi (Household finances) for the years 1975 to 2013, and that the statistics began in 1975.
Links retrieved 9 Sep 2026.
Extended on 14 Sep 2026 with the two classification documents behind the socio-economic classification, the full report on income distribution, the full report and the two data files behind the OECD's figures, the World Bank's factsheet on the poverty lines and its country classification, an exact address for Eurostat's table, the American research institute's own definition and method, and the museum record and the cultural heritage information for the photograph. The twelve groups and group 46 are in the aggregated classification and not in the full one from 1982, where the same layers are numbered 44 and 45. The official Swedish income distribution statistics began in 1975.