OWN THE FUTURE · SEASON 3 · RAPID URBANIZATION
What happened to jobs when the machines came?
Automation is when a machine does work that a person used to do. We explain where it has happened, what it did to jobs and how economists measure it.
Published 10 Sep 2026 · About 10 minutes to read
In 1910 half of Sweden's working population worked in agriculture, forestry, hunting and fishing.3, 12 Exactly 1,015,800 people out of 2,031,500.3, 12 In 1985 there were 213,200 out of 4,285,100, or five per cent.3, 12 The number of people working in agriculture, forestry, hunting and fishing had fallen by about four fifths, while the number of people working in the country more than doubled over the same period.3, 12
That is automation on a scale a reader can recognise. No single invention, no single year, but a shift that took three generations. This article counts it, and then goes through how economists measure the same thing today.
What the technology is made of is counted in S1:E2 Robotics and S1:E1 AI. This one is about work and about measurement.
What the word means, and what it does not mean
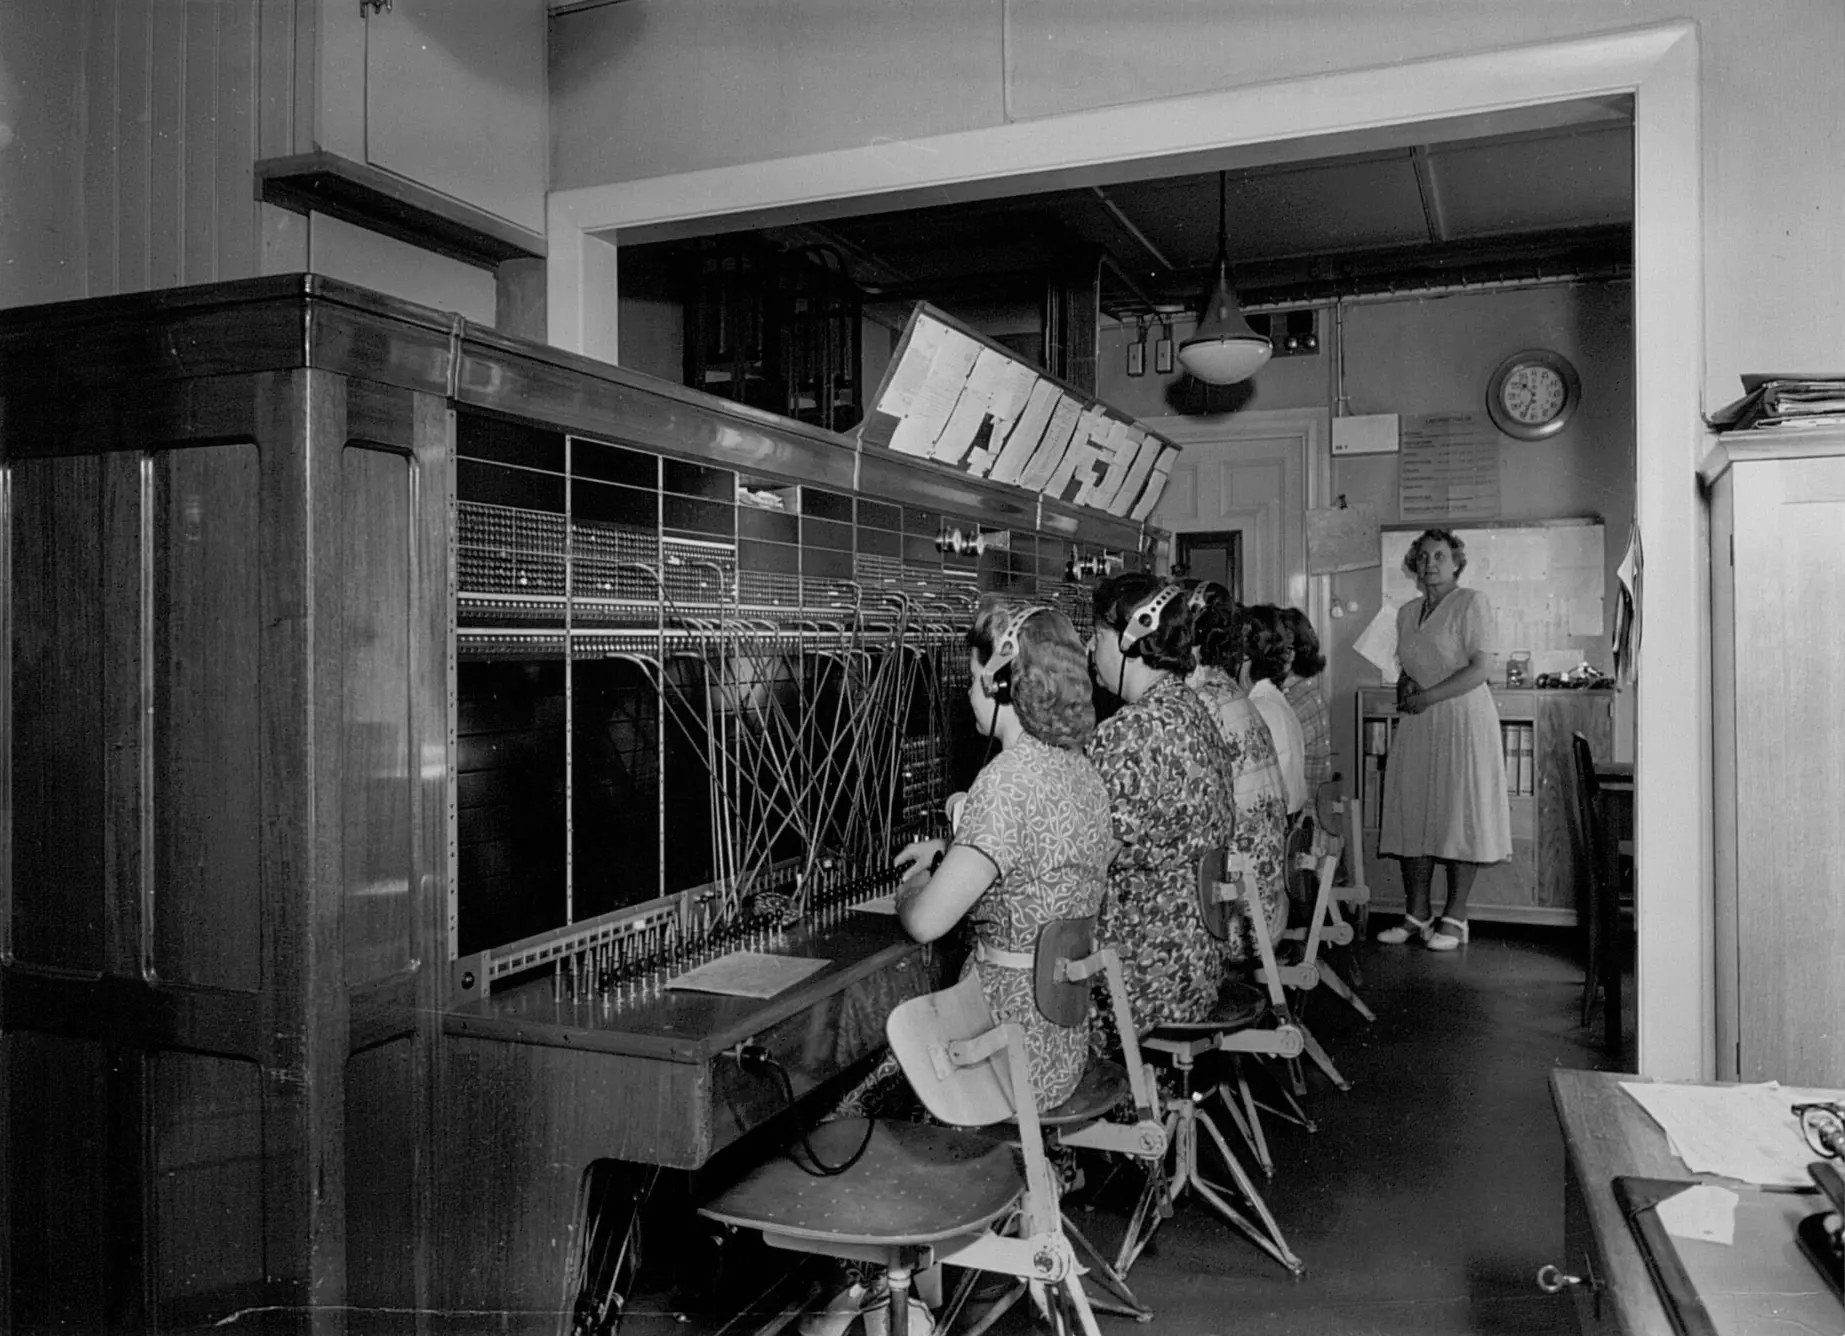
Automation is when a task a person used to do is done by a machine instead. The word says nothing about which machine, and that is the whole difficulty in measuring it. A combine harvester, an automatic telephone exchange, an industrial robot and a computer program that books an invoice are the same thing in terms of the work, but completely different things in terms of the technology.
There are no statistics that measure automation directly. What is measured is the consequences: how much is produced per hour, where people work, and how much equipment has been bought. Each measure captures one part of the process and misses the rest.
The long series
The population and housing censuses follow the shift census by census. The share in agriculture fell from 50% in 1910 to 41% in 1920, 36% in 1930, 24% in 1940, 22% in 1945, 20% in 1950, 14% in 1960, 12% in 1965, 8% in 1970, 6% in 1975, 6% in 1980 and 5% in 1985.3, 12
In the same series, manufacturing behaves like a wave. It had 476,300 working people in 1910, peaked at about 1,050,000 in 1960 and stood at 917,900 in 1985.3, 12 As shares, that is 23.4%, 32.4% and 21.4%.12 So industry was both the sector that took in the workforce from agriculture and the one that later passed it on.
The item that grew in both phases was the same. Public administration and other services, together with unspecified activity, grew from 224,600 working people in 1910 to 1,695,800 in 1985, or 7.55 times.3, 12
Industry today: more with fewer
The national accounts begin in 1980 and make the same thing measurable to two decimal places.1, 13 Between 1980 and 2024 the number of hours worked in Swedish manufacturing fell from 1,410 to 1,001 million, or by 29.0%.1, 13 The number of people employed fell more, from 904,400 to 571,100, or by 36.9%.1, 13
At the same time value added at constant prices rose 2.70 times, from 260,391 to 702,330 million kronor at 2020 prices.2, 14 The ratio between the two, labour productivity, therefore rose 3.80 times.1, 2, 13, 14
as much value added per hour worked was produced by Swedish manufacturing in 2024 as in 1980, counted at constant prices. From 185 to 701 kronor per hour.
SOURCE: STATISTICS SWEDEN, NATIONAL ACCOUNTS, OWN DIVISIONThat figure contains both forces at once. The numerator grew and the denominator shrank, and anyone who has understood that has understood the whole measurement problem. The calculation needs no model and no assumption, just a division between two tables that Statistics Sweden publishes.
The pace is slower than the figures above suggest, and it varies. Productivity in the Swedish business sector rose by an average of 2% a year between 1993 and 2023, but only 1% a year in the period 2009 to 2023.9, 17 For the economy as a whole, gross domestic product per hour worked rose from 584 to 779 kronor between 2000 and 2025, at 2025 prices.15, 16 That works out at 1.17% a year.
The National Institute of Economic Research puts why the measure matters like this: higher wages and labour costs are made possible by a rise in the value added produced per hour worked.9, 17
The hours did not disappear from the economy
The figure above is misleading without its counterweight, so here it is. Over exactly the same 44 years, the number of hours worked in the whole Swedish economy rose from 6,595 to 8,608 million, or by 30.5%.1, 13 The number of people employed rose from 4,327,900 to 5,451,300.1, 13
The average time per employed person was much the same, 1,524 hours in 1980 and 1,579 hours in 2024.1, 13 So more hours were worked by more people, not by the same people working longer.
Industry's hours turned up somewhere else. Service producers' share of the employed rose from 31.6 to 47.9%, and their hours worked almost doubled.1, 13 Sweden worked more hours in 2024 than in 1980. What changed was the part of the economy where the hours were worked.
Three measures, three questions
Economists measure automation in three fundamentally different ways, and they answer different questions.
Productivity and employment
Labour productivity, value added per hour worked, measures what comes out per hour. The measure is in the national accounts. It can be affected by automation, but it does not separate automation's contribution from other changes.
Employment by industry and occupation measures where the jobs are, and so where they disappeared and where they appeared. It is the measure behind the long series above.
Robot density measures equipment
Robot density, the number of installed industrial robots per 10,000 employees in manufacturing, measures equipment.6, 19 Sweden had 377 industrial robots per 10,000 employees in 2024, fifth in the world, while South Korea had 1,220.6, 19 The measure is often quoted as a measure of how automated a country is, but it has a denominator that leaves out most things: manufacturing is about 10.5% of the employed in Sweden.1, 13 If the rest of the economy is automated, it does not show at all in that figure.
That the measure tracks equipment and not work shows most clearly in a comparison. South Korea has the world's highest robot density, with 1,220 robots per 10,000 employees, but lower gross domestic product per hour worked than Sweden: 59.45 against 97.29 dollars adjusted for purchasing power in 2024.11, 19, 21 So more robots do not automatically mean more produced per hour.
The measure is also unstable. The organisation that publishes it gave the world average as 162 robots per 10,000 employees for 2023 and 132 for 2024.6, 19, 20 In the later edition China's figure was recalculated using updated labour market data from the country's statistics bureau, and the organisation's own report for the same year gives 177 instead. An average that falls by almost a fifth between two editions partly measures the denominator, not the technology.19, 20
Which occupations shrank, and which grew
The occupational register makes the shift visible over ten years. Between 2014 and 2024 the number of employed prepress technicians, printers and bookbinders fell from 8,704 to 5,430, or by 37.6%.4, 22, 23 Postal workers and mail sorters went from 18,200 to 13,156, down 27.7%.4, 24, 25 Hand packers and other factory workers went from 12,606 to 9,251, down 26.6%.4, 24, 25
In the other direction, IT architects, systems developers and test managers grew from 101,543 to 182,732 employees, or by 80.0%.4, 22, 23 Shop staff grew from 205,147 to 249,331.4, 22, 23
So the pattern is that work changes content rather than disappearing. Occupations where the task is to repeat a step shrink. Occupations where the task is to decide what should be done grow.
Sweden compared
Counted as gross domestic product per hour worked, Sweden stood at 97.29 dollars adjusted for purchasing power in 2024.11, 21 The OECD area as a whole stood at 84.12, Germany at 100.66, the United States at 100.12, South Korea at 59.45 and Mexico at 40.21.11, 21
The pace of change also differs. Between 2000 and the first quarter of 2026, productivity in the whole economy rose by an average of 1.3% a year in Sweden and 0.8% in the euro area.10, 18 For manufacturing alone the figures were 2.8% and 2.2% a year.10, 18 The most recent year's movement is stronger: between the first quarter of 2025 and the first quarter of 2026, productivity in Swedish manufacturing rose by 8.0%, against minus 3.1% in the euro area.10, 18 The Swedish National Mediation Office says the rise was driven both by weak growth in hours worked and by higher value added, the same two forces as in the long series.10, 18
Estimates against outcomes
The 47% estimate
The most widely quoted figure on the subject is a model estimate. In 2013 Carl Benedikt Frey and Michael Osborne estimated that 47% of US employment was in a high-risk category for computerisation.7 In 2014 Stefan Fölster made a similar estimate for Sweden for the Swedish Foundation for Strategic Research and arrived at 53%.8
Both studies state that the estimate is based only on the technical conditions, whether an occupation could in principle be automated.7, 8 The US study adds that it does not try to estimate how many jobs will actually be automated, while the Swedish one keeps a horizon of twenty years.
What the outcome showed
In the Swedish estimate, cashiers were given a probability of 95.3%.8 In Statistics Sweden's occupational register the number of employed cashiers was 13,567 in 2014 and 15,655 in 2024.4, 22, 23 For shop staff the figures were 205,147 and 249,331.4, 22, 23 The register changed its source in 2022 and widened the age range from 16 to 64 to 16 to 69 in 2023, so the differences do not only show changes in the number of jobs.4, 23, 27
The conclusion from this is about method, not a counter-forecast. Technical possibility is not the same as outcome, and an estimate of what can be automated says nothing about the pace.
The estimate is based on 702 US occupations classified with a statistical model by how little they require in dexterity, originality, artistry and social skill.7 The authors explicitly reject the older division by what can be described as rules. The Swedish version carried the US probabilities over to 109 Swedish occupations via the occupational code systems, without recalculating the model.8 According to the report, the difference from the US figure comes from Sweden having more employees in industrial occupations.
What the figures do not say
Three breaks in the time series limit what can be compared. The labour force surveys were changed in January 2021 to meet an EU regulation, which gives a break in the series.5, 26 The national accounts are unbroken from 1980 and are therefore used in this article.1, 2, 13, 14 The population and housing censuses also change definition during the period. Up to 1950 all working people are counted, in 1960 and 1965 those who worked at least half normal working hours, from 1970 to 1980 those who worked at least twenty hours, and in 1985 those who worked at least one hour.
The occupational register has a third break. The share of employees with an unknown occupation was around 5% up to and including 2022 and fell to 0.5% in 2023, when Statistics Sweden began filling in missing occupation data with a model.4, 27 That makes all rises in the register systematically overstated and all falls understated. The figures on cashiers above should be read with that in mind.
And there is no measurement of automation in the service sector. Robot density only covers manufacturing, productivity is measured by industry without separating what is technology and what is something else, and the occupational register shows where people work but not why the numbers change. Roughly half of the employed work in industries where automation has no measure of its own at all.1, 13
What to take away
Between 1980 and 2024 hours worked in Swedish manufacturing fell from 1,410 to 1,001 million and the number employed from 904,400 to 571,100, while value added at constant prices rose 2.70 times.1, 2, 13, 14 Hours in the whole economy rose 30.5% over the same time.1, 13 The shift is slow and structural: agriculture's share of the working population went from 50% in 1910 to 5% in 1985, and work changes content rather than ending.3, 12 Follow three recurring figures: Statistics Sweden's national accounts on hours worked and value added by industry, Statistics Sweden's occupational register by occupation, and the annual robot density from the International Federation of Robotics.1, 4, 6
The next episode is S3:E5 Transportation, about how Sweden moves, counted in journeys and freight.
Education, not advice.
The fund
Behind the library stands a fund.
Own The Future is published by AIX. The library is the knowledge; AIX Dynamic is the tool, a systematic securities fund (UCITS) that follows the trend and steps aside when risk rises.
This is marketing. Fund units can both rise and fall in value. Read the key information document (KID) and the prospectus before you invest; you will find them on the fund's page at Avanza.
34 UNITHOLDERS · AS OF 15 SEP 2026The future in your inbox.
The most important things from each area, without the noise and without the hype.
Sources
- Statistics Sweden (SCB), Statistikdatabasen, nationalräkenskaperna (statistical database, the national accounts), the table on labour input by industry (SNI 2007), years 1980 to 2024, updated 28 Aug 2026. Hours worked and average number employed in manufacturing and in the whole economy.
- Statistics Sweden (SCB), Statistikdatabasen, nationalräkenskaperna (statistical database, the national accounts), the table on GDP by output and industry (SNI 2007), years 1980 to 2024. Value added at constant prices with reference year 2020. The productivity figures in the text are the editors' own division of the two tables.
- Statistics Sweden (SCB), historisk statistik över förvärvsarbetande efter näringsgren (historical statistics on the working population by industry) at the population and housing censuses 1910 to 1985. The shares in agriculture, forestry, hunting and fishing, the development of manufacturing and the growth in public administration and other services.
- Statistics Sweden (SCB), Statistikdatabasen, yrkesregistret (statistical database, the occupational register). The number of employed cashiers and shop staff in 2014 and 2024, and the share with an unknown occupation before and after the change of source.
- Statistics Sweden (SCB), Statistikdatabasen, arbetskraftsundersökningarna (statistical database, the labour force surveys), and the agency's documentation of the change in January 2021 to meet EU Regulation 2019/1700.
- International Federation of Robotics, World Robotics, press releases on robot density in 2024. The number of industrial robots per 10,000 employees in manufacturing by country.
- Carl Benedikt Frey and Michael A. Osborne, The Future of Employment: How Susceptible Are Jobs to Computerisation?, Oxford Martin School 2013. The estimate that 47% of jobs in the US were in a high-risk category, and the authors' own caveat that the estimate is based on the technical conditions.
- Stefan Fölster, Vartannat jobb automatiseras inom 20 år (Every other job will be automated within 20 years), Swedish Foundation for Strategic Research (Stiftelsen för Strategisk Forskning) 2014. The Swedish estimate of 53% and the probabilities by occupation.
- National Institute of Economic Research (Konjunkturinstitutet), Lönebildningsrapporten (the wage formation report). The definition of labour productivity and the average productivity growth in the business sector from 1993 to 2023.
- Swedish National Mediation Office (Medlingsinstitutet), Löneläget juni 2026 (The wage situation, June 2026). Productivity growth in Swedish manufacturing compared with the euro area.
- OECD, Data Explorer, the productivity statistics. International comparison of value added per hour worked.
- Statistics Sweden (SCB), Tidsseriehäfte: förvärvsarbetande, folk- och bostadsräkningarna 1910 till 1985 (Time series booklet: the working population, population and housing censuses 1910 to 1985), published 1989, digitised 2009 (PDF, 46 pages). Supports table 21 (numbers in hundreds) with 10,158 in agriculture, forestry, hunting and fishing in 1910 and 2,132 in 1985, 20,315 and 42,851 in all industries, manufacturing's 4,763, 10,500 and 9,179, and the item public administration and other services together with unspecified activity at 2,246 and 16,958, and table 22 (per cent) with the whole series of shares 50, 41, 36, 24, 22, 20, 14, 12, 8, 6, 6 and 5. The booklet also carries the break in definition in footnote 1.
- Statistics Sweden's statistical database (SCB Statistikdatabasen), Arbetskraftsinsats (ENS2010) efter näringsgren SNI 2007, år 1980 till 2024 (Labour input, ESA2010, by industry SNI 2007, years 1980 to 2024), updated 28 Aug 2026. Supports hours worked of 140,964 and 100,139 in tens of thousands for manufacturing, 659,541 and 860,760 for the whole economy, average number employed of 904.4 and 571.1 thousand in manufacturing, 4,327.9 and 5,451.3 thousand in the whole economy, and 1,368.7 and 2,613.1 thousand among service producers.
- Statistics Sweden's statistical database (SCB Statistikdatabasen), BNP från produktionssidan (ENS2010) efter näringsgren SNI 2007, år 1980 till 2024 (GDP by output, ESA2010, by industry SNI 2007, years 1980 to 2024), updated 29 May 2026. Supports manufacturing's value added at constant prices with reference year 2020, 260,391 million kronor in 1980 and 702,330 million kronor in 2024.
- Statistics Sweden's statistical database (SCB Statistikdatabasen), BNP från användningssidan (ENS2010), försörjningsbalans efter användning, kvartal 1980K1 till 2026K2 (GDP by expenditure, ESA2010, supply and use balance, quarters 1980Q1 to 2026Q2), updated 28 Aug 2026. Supports GDP at market prices at constant prices with reference year 2025, 4,168,496 million kronor in 2000 and 6,644,105 million kronor in 2025, which is the numerator in the figure for gross domestic product per hour worked.
- Statistics Sweden's statistical database (SCB Statistikdatabasen), Arbetskraftsinsats (ENS2010) efter näringsgren SNI 2007, kvartal 1980K1 till 2026K2 (Labour input, ESA2010, by industry SNI 2007, quarters 1980Q1 to 2026Q2), updated 28 Aug 2026. Supports hours worked in the whole economy of 714,244 in tens of thousands in 2000 and 852,622 in 2025, which is the denominator in the same figure.
- National Institute of Economic Research (Konjunkturinstitutet), Lönebildningsrapporten 2024, Avtalsrörelse efter historisk minskning av reallönerna (The wage formation report 2024, wage bargaining after a historic fall in real wages), 22 Oct 2024 (PDF). Supports business sector productivity of 2% a year from 1993 to 2023 and 1% a year from 2009 to 2023, and the sentence saying higher wages and labour costs are made possible by rising value added per hour worked.
- Swedish National Mediation Office (Medlingsinstitutet), Löneläget juni 2026 (The wage situation, June 2026), 25 Jun 2026 (PDF). Supports 1.3 and 0.8% a year for the whole economy and 2.8 and 2.2% a year for manufacturing from 2000 to 2026Q1 (tables A5a and A5b, page 32), and 8.0 against minus 3.1% between 2025Q1 and 2026Q1 and the explanation of weak growth in hours and higher value added (page 17).
- International Federation of Robotics, Robot Density Surges in Europe, Asia, and Americas, press release 8 Apr 2026. Supports South Korea's 1,220 robots per 10,000 employees as the world's highest density, Sweden's 377 and fifth place in the top ten, and the world average of 132 for 2024 and the recalculation of China's figure using updated labour market data.
- International Federation of Robotics, Global Robot Density in Factories Doubled in Seven Years, press release 20 Nov 2024. Supports the world average of 162 robots per 10,000 employees for 2023.
- OECD, Productivity database, GDP per hour worked, US dollars per hour, PPP converted, current prices, 2024, extract from the OECD statistics service. Supports Sweden 97.29, OECD total 84.12, Germany 100.66, the United States 100.12, South Korea 59.45 and Mexico 40.21.
- Statistics Sweden's statistical database (SCB Statistikdatabasen), Anställda 16 till 64 år i riket efter yrke (3-siffrig SSYK 2012), arbetsställets sektortillhörighet, ålder och kön, år 2014 till 2018 (Employees aged 16 to 64 in Sweden by occupation, 3-digit SSYK 2012, sector of workplace, age and sex, years 2014 to 2018). Supports the 2014 figures 8,704 (prepress technicians, printers and bookbinders etc.), 101,543 (IT architects, systems developers and test managers etc.), 205,147 (shop staff) and 13,567 (cashiers etc.).
- Statistics Sweden's statistical database (SCB Statistikdatabasen), Anställda i riket efter yrke (3-siffrig SSYK 2012), arbetsställets sektortillhörighet, ålder och kön, baserat på BAS, år 2020 till 2024 (Employees in Sweden by occupation, 3-digit SSYK 2012, sector of workplace, age and sex, based on BAS, years 2020 to 2024), updated 16 Jan 2026. Supports the 2024 figures 5,430, 182,732, 249,331 and 15,655, and that the age groups now go up to and including 65 to 69.
- Statistics Sweden's statistical database (SCB Statistikdatabasen), Anställda 16 till 64 år i riket efter yrke (4-siffrig SSYK 2012), arbetsställets sektortillhörighet och kön, år 2014 till 2018 (Employees aged 16 to 64 in Sweden by occupation, 4-digit SSYK 2012, sector of workplace and sex, years 2014 to 2018). Supports the 2014 figures of 18,200 for postal workers and mail sorters (4420) and 12,606 for hand packers and other factory workers (9320).
- Statistics Sweden's statistical database (SCB Statistikdatabasen), Anställda i riket efter yrke (4-siffrig SSYK 2012), arbetsställets sektortillhörighet och kön, baserat på BAS, år 2020 till 2024 (Employees in Sweden by occupation, 4-digit SSYK 2012, sector of workplace and sex, based on BAS, years 2020 to 2024), updated 16 Jan 2026. Supports the 2024 figures of 13,156 for postal workers and mail sorters and 9,251 for hand packers and other factory workers.
- Statistics Sweden (SCB), Förändringar i Arbetskraftsundersökningarna (Changes in the labour force surveys), in-depth information on the surveys. Supports that the labour force surveys were adapted to EU Regulation 2019/1700 on 1 Jan 2021 and that the changes caused breaks in the time series. The same is stated in the quality declaration for the labour force surveys.
- Statistics Sweden (SCB), Kvalitetsdeklaration, Yrkesregistret med yrkesstatistik, referensår 2023 (Quality declaration, the occupational register with occupational statistics, reference year 2023), 19 Dec 2024 (PDF). Supports that the occupational register changed source from RAMS to BAS from the 2022 data, that the imputation model was introduced in 2023, and that from the 2023 data employees are published for ages 16 to 69 instead of 16 to 64.
- National Museum of Science and Technology (Tekniska museet), Vaxholm. Telefonstationen (växelbord med telefonister) år 1951 (Vaxholm. The telephone exchange, switchboard with telephone operators, 1951), collection record TEKA0136394 on DigitaltMuseum. Supports the subject, the year 1951, that the museum record gives the photographer as unknown, and the licence Public Domain Mark.
Links retrieved 9 Sep 2026. Extended on 13 Sep 2026 with Statistics Sweden's time series booklet on the population and housing censuses, the individual tables in the national accounts and the occupational register, the editions from the National Institute of Economic Research and the Swedish National Mediation Office, the two press releases on robot density, the OECD extract and the museum record for the photograph. The figures for gross domestic product per hour worked could not be reproduced at the price level the article gives; Statistics Sweden's quarterly tables at 2025 prices give 584 and 779 kronor with the same annual rate. The occupational register changed source from the 2022 data and age range from the 2023 data, so the figures for 2014 and 2024 come from two separate tables.