OWN THE FUTURE · 02 OF 05
Demographics & Social Change
We are growing older, healthier and more numerous in some parts of the world, and fewer in others. What that does to care, work and saving.
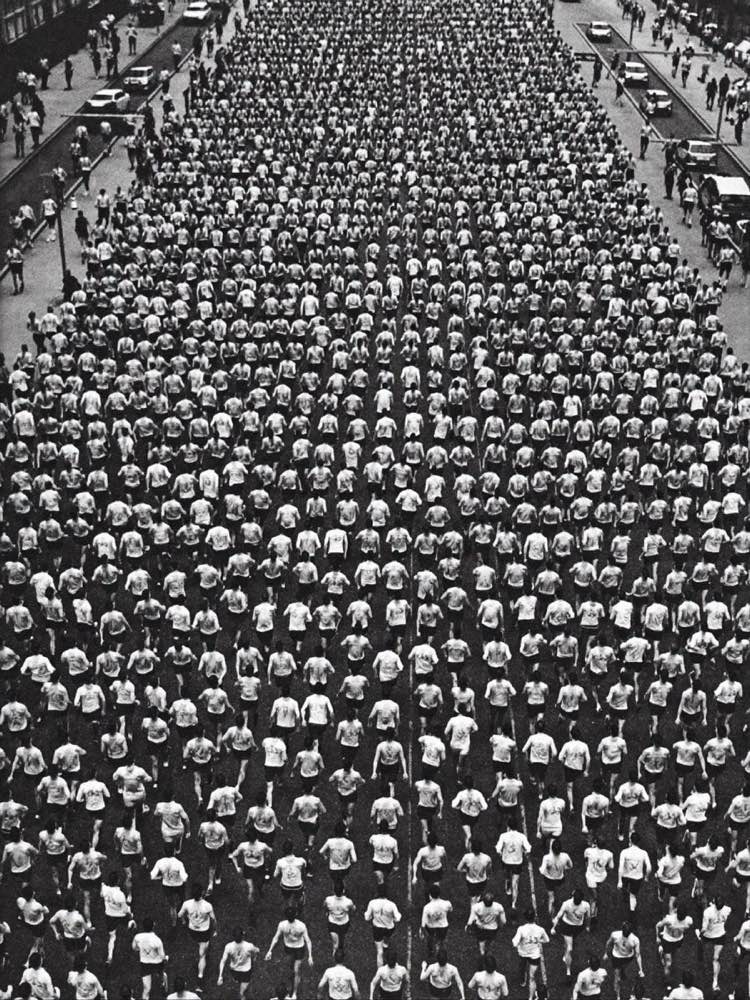
The shift
In 1950 global life expectancy was 46 years. Today it is over 73.
More healthy years change how we work, how we are cared for, where we live and how we save. Demographics moves slowly, but it can be read decades ahead.
Source: UN, World Population Prospects.
Season 2 · Introduction
What are demographics and social change?
Demographics is the study of populations. It is about how many people there are in the world, how old they live to be and how many children are born. Social change is what happens in society when those figures shift, for example how much goes to healthcare or how many people are of working age. The figures move slowly, year by year, but the difference becomes large if you compare a few decades back.
Take this figure as an example. In 1974, 5.5% of the world's population was 65 or older, about one person in eighteen. In 2024, fifty years later, the share was 10.3%, about one in ten. In other words, the share of older people has almost doubled in fifty years.
A large part of the explanation is how many children are born per woman, what is usually called fertility. In 1960 an average of 4.7 children were born per woman in the world. In 2023 the figure was 2.2 children per woman, close to what is called the replacement level, roughly the level at which one generation replaces the one before without growing larger. When fewer children are born compared with how many older people are already in the population, the share of older people rises by itself. It is a bit like a class photo where the older year groups stay in the picture while the younger rows behind them get smaller.
It may sound contradictory that the population is still growing. From 1960 to 2023 the world's population went from about 3 billion to just over 8.1 billion people. The explanation is that there are more women of childbearing age today than ever before, because earlier generations were larger. That means more children are born in absolute numbers, even when each woman has fewer on average. Still, fewer children per woman and longer lives pull in the same direction: an ever larger share of older people in the population, year after year.
So two curves meet in the middle of the population pyramid: fewer newborns at the base and more pensioners at the top, at the same time.
This shift is what lies behind the area of demographics and social change. When the share of older people grows and fewer young people are born at the same time, the pressure changes on healthcare, the labour market and research on the genome and ageing. The articles in this area go through each part in turn.
Education, not advice.
Sources
- UNFPA (the United Nations Population Fund), "Ageing", the figure that the share of the world's population aged 65 or older rose from 5.5% in 1974 to 10.3% in 2024
- World Bank, World Development Indicators, "Fertility rate, total (births per woman), World", global fertility of 4.7 children per woman in 1960 and 2.2 children per woman in 2023
- World Bank, World Development Indicators, "Population, total, World", global population of about 3.0 billion in 1960 and about 8.1 billion in 2023 (data checked directly via the World Bank API: 3,021,512,598 and 8,062,923,417 respectively)
The library
Five episodes.
Caption and source
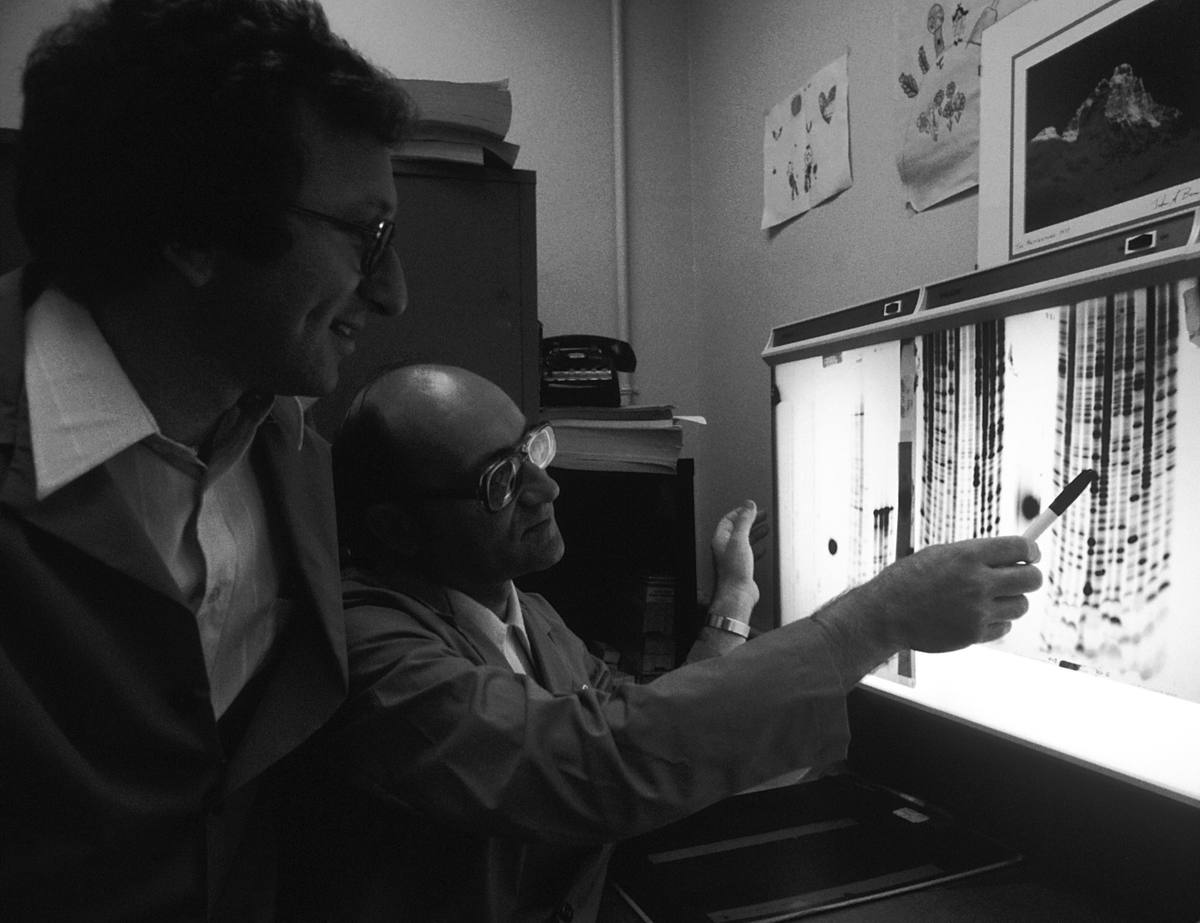
A researcher reads the genetic code on a light box, 1980. Ten years later the project that would map the entire human genome began. Photograph: Linda Bartlett, 1980. National Cancer Institute. Public domain.
Genomics
The genome is the set of instructions found in every cell in the body. We explain what a gene is, how researchers read the genome and what gene scissors are used for.
Caption and source
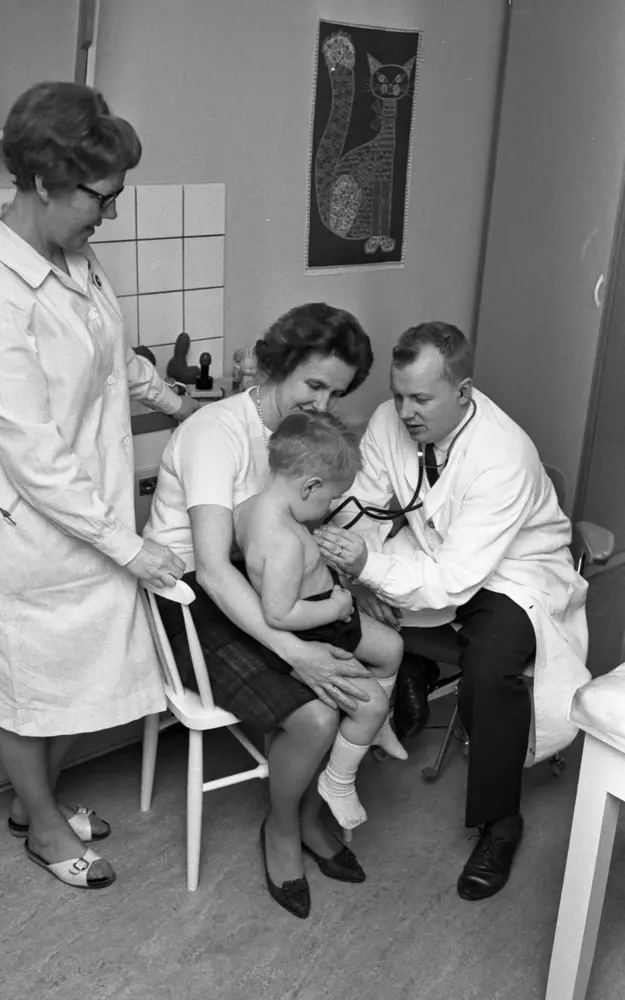
A health check at a child health centre in Örebro on 11 April 1967. The child health centres belong to the decades after the great fall in infant mortality, which for boys went from 108 per 1,000 born in 1900 to 24 in 1950. Photograph: Örebro Kuriren, 1967. Örebro County Museum (Örebro läns museum), OLM-2012-8-7699. Public domain.
Longevity
We live longer than our parents' generation, and the statistics show why. Here we go through what has happened to life expectancy and what research on ageing is looking into.
Caption and source
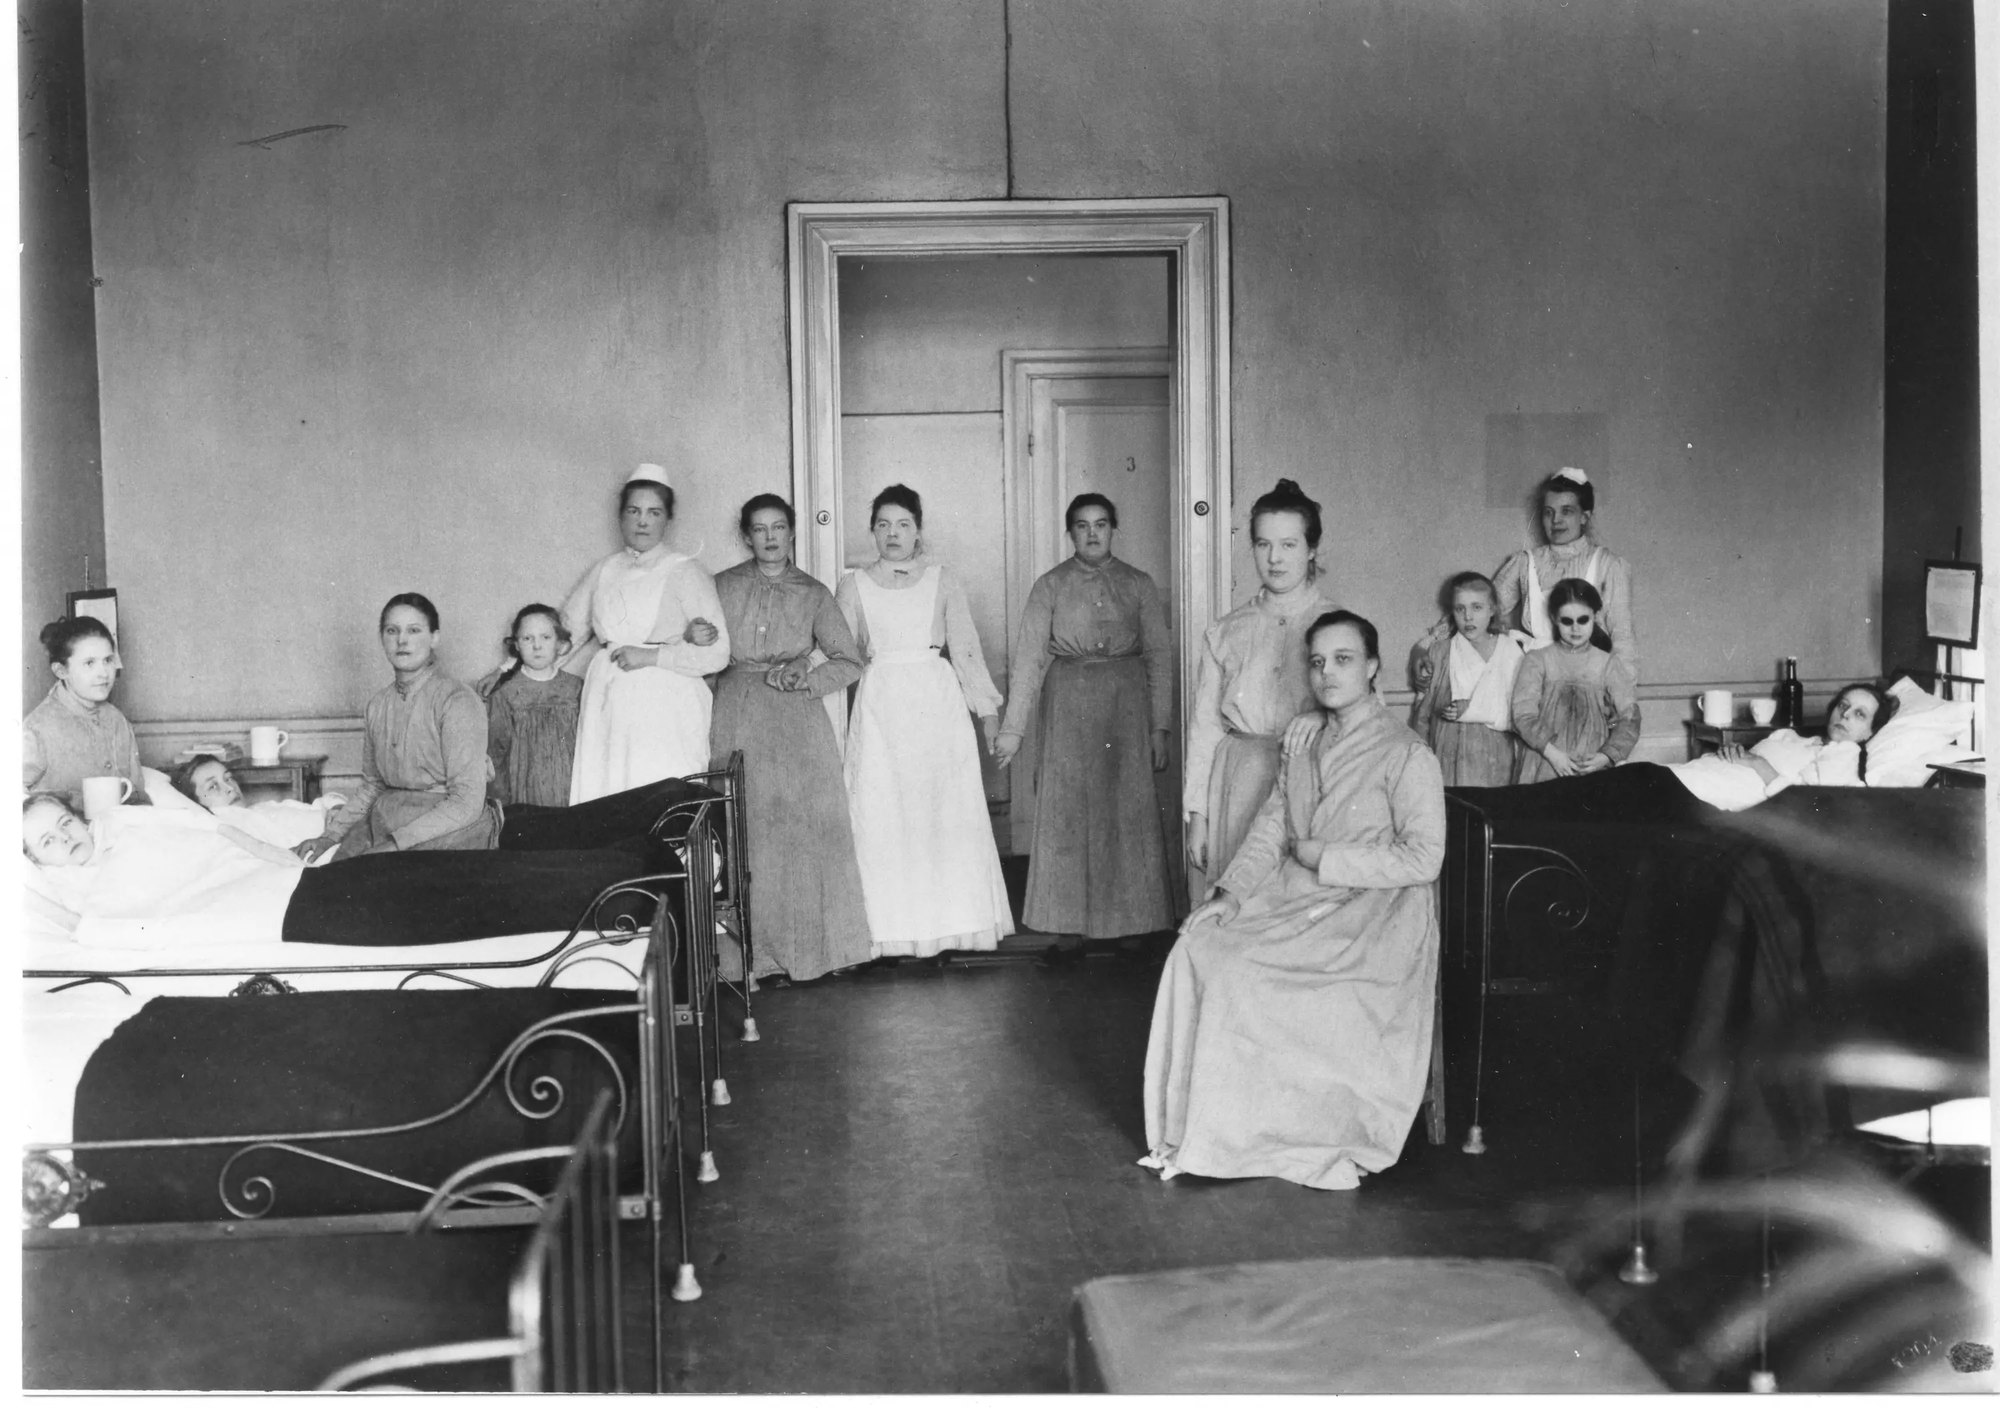
A hospital ward with patients and nurses at Stallhagen in Västerås, dated to 1920 in the museum's record, which names no photographer. In 2024 there were 19,726 available hospital beds in Sweden, counted as a daily average. In 2016 the figure was 23,209. Västmanland County Museum (Västmanlands läns museum), Vlm-B 10381. Public domain.
Healthcare
Healthcare is one of the largest activities in society, counted in both money and staff. We explain how it is organised, what it costs and which parts are changing fastest.

Caption and source
Nilsson, a bricklayer from Långlöt, celebrates his 100th birthday at the Halltorp old people's home. The museum record is undated. In 1970 there were 127 people in Sweden aged 100 or older. In 2025 there were about 3,000. Photograph: Allan Bernving. Kalmar County Museum, KLMF.Bernvingålderdom8. Public domain.
Ageing
In many countries the share of older people is larger than it was a generation ago, and it shows in everything from housing to the labour market. We explain what the figures show and which words demographers use.
How many of us are old at the same time? Counted from 1900 to 2025
Caption and source
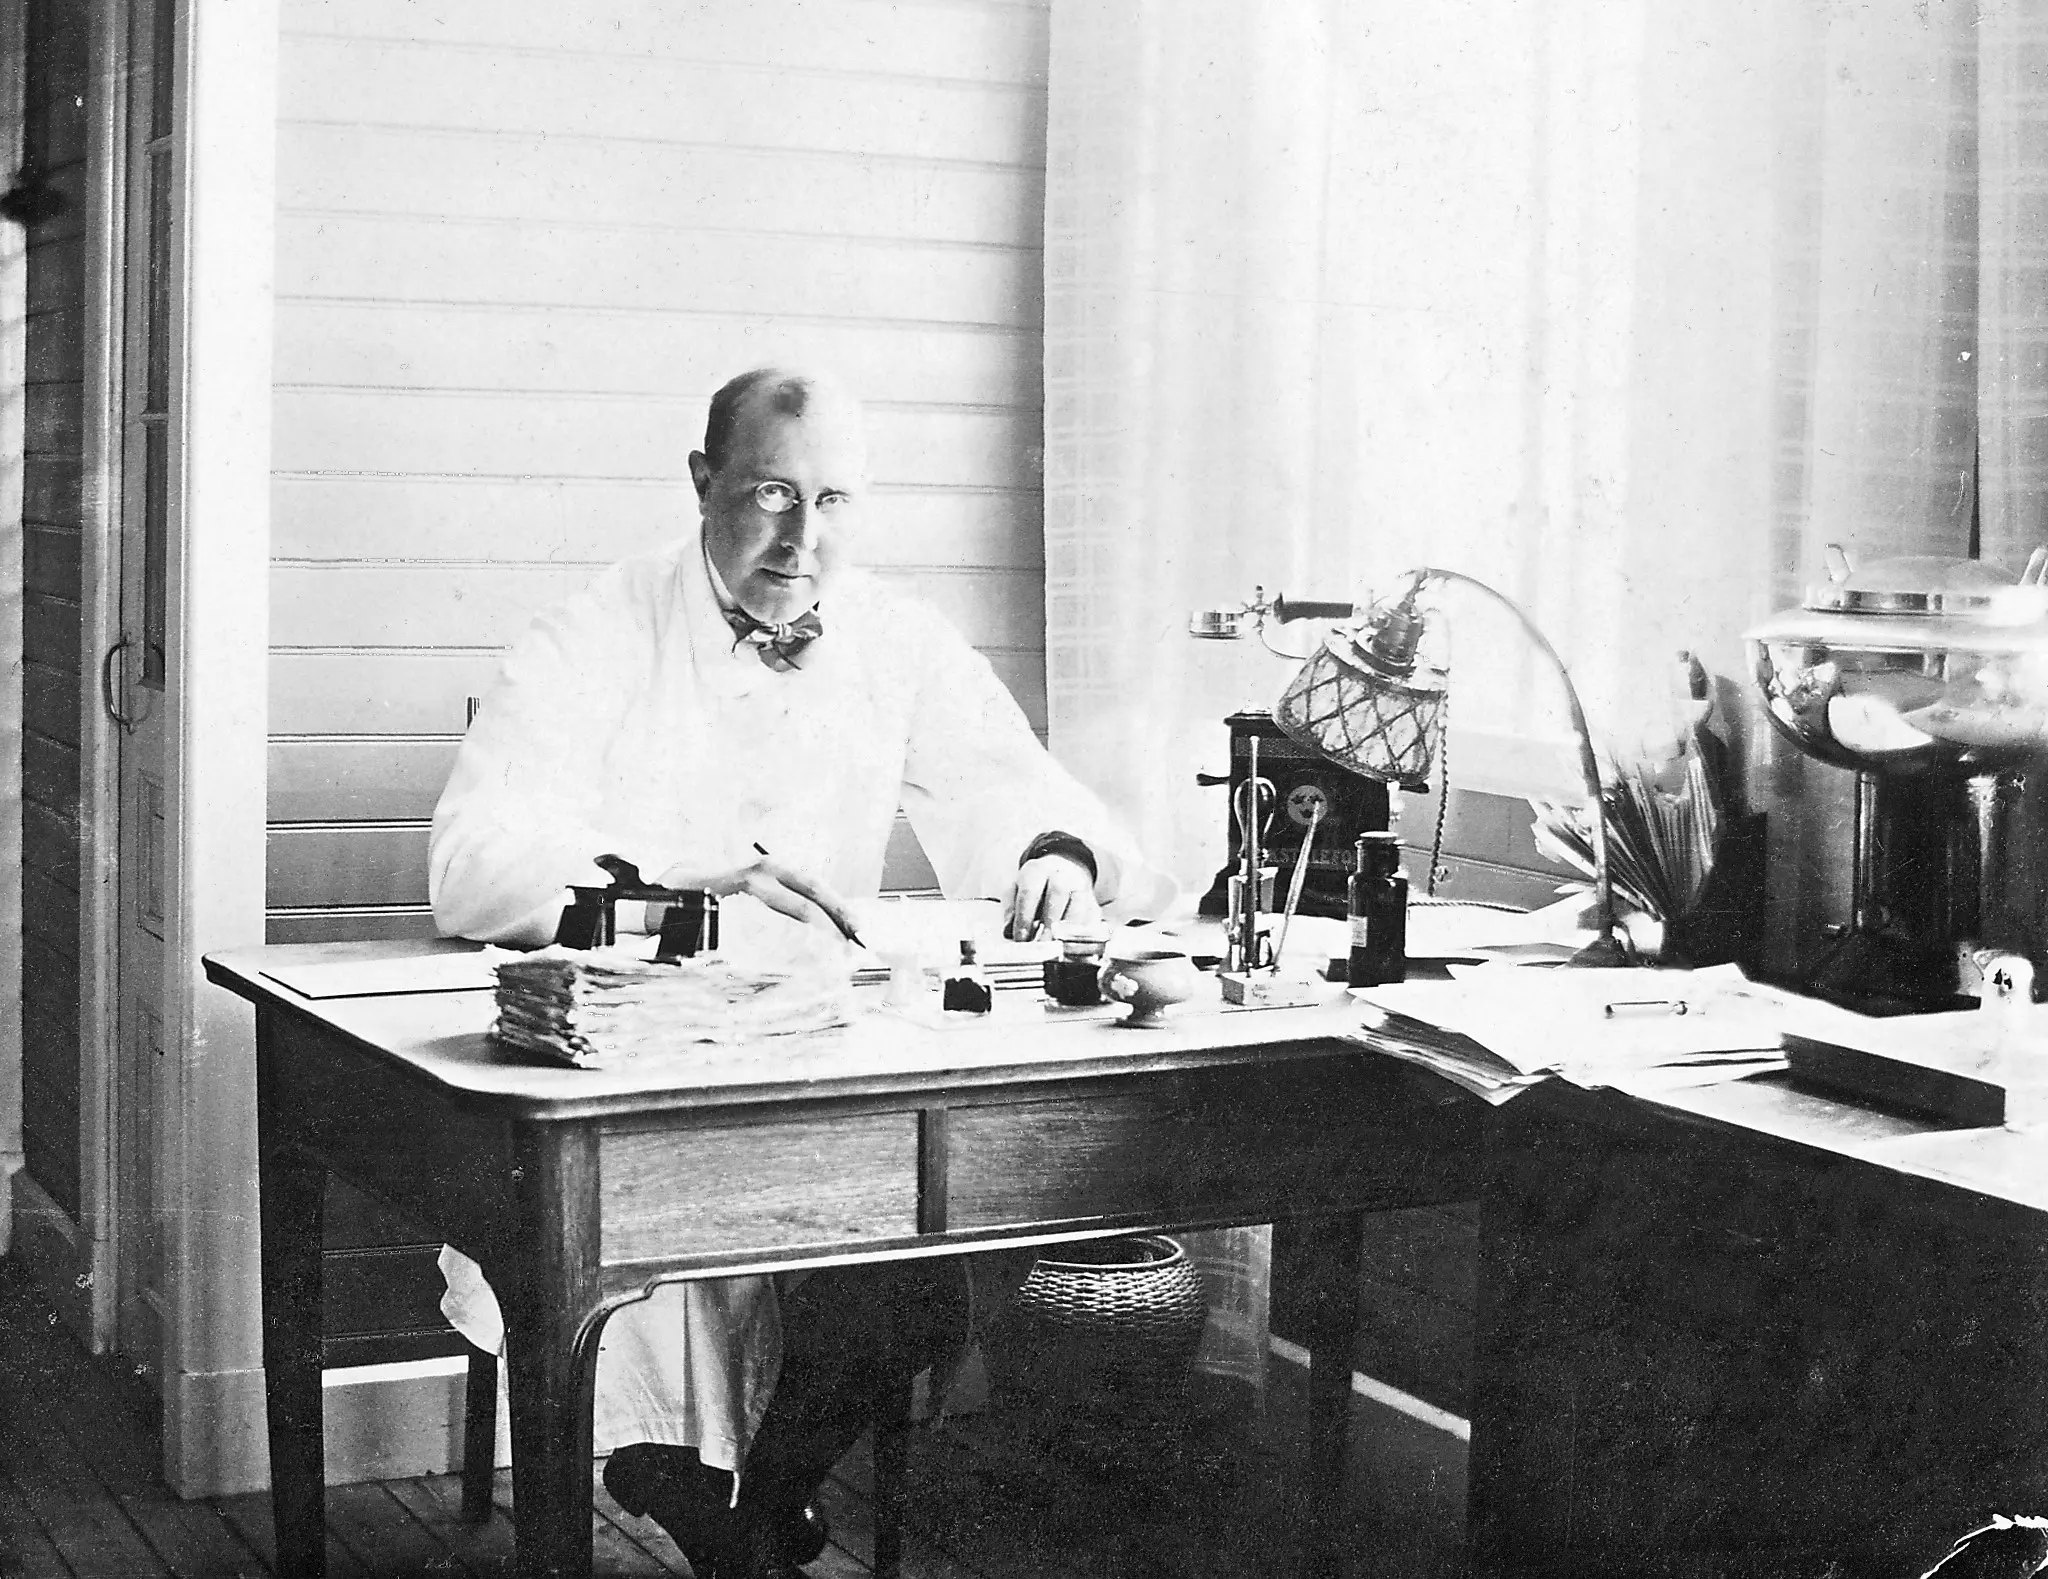
Doctor Lövberg at his desk at the coastal sanatorium in Apelviken outside Varberg. Behind the lamp stands a long-distance telephone. At about the same time, Willem Einthoven had already proposed recording electrocardiograms at a distance. The museum record dates the picture to 1920 or 1921 and names no photographer. Halland Museum of Cultural History (Hallands kulturhistoriska museum), KSA105. Public domain.
Digital Health
Remote care means you meet healthcare through a screen or an app instead of in a waiting room. We explain what already works that way today and what still needs a visit in person.
One article per episode. Subscribe and you will get each new article straight away.
The future in your inbox.
The most important things from each area, without the noise and without the hype.